U.S. Investment Grade Credit: Quality (Still) Comes with Yield

Anil Katarya, CFA
Global Head of Investment Grade Credit

Travis King, CFA
Head of U.S. Investment Grade Corporates

Hans Sapra
Co-Head of Client Portfolio Management, Fixed Income

Key Takeaways
Why U.S. investment grade (IG) credit now? With today’s high rates, an improved U.S. economic growth outlook and solid corporate fundamentals, high-quality corporate bonds offer attractive income and total return potential.
Why U.S. IG for the long term? It’s one of the largest and most liquid asset classes in the world (Exhibit 4), leaving it ripe for active managers to capture opportunities. And it has historically demonstrated low correlation to equities, U.S. Treasuries and riskier fixed income segments (Exhibit 7).
IG credit can also help mitigate downside risk, having generally preserved capital better during periods of crisis than other risk assets and even U.S. Treasuries (Exhibit 8).
With yields materially higher as a result of elevated interest rates, high-quality markets such as U.S. investment grade corporate bonds offer attractive income and total return potential. The asset class can also offer low correlation to other risk assets, as well as help mitigate downside risk.
Why U.S. investment grade now?
We see multiple reasons why, in the current market environment, U.S. investment grade (IG) bonds offer an attractive, high-quality opportunity for investors.
- A supportive macro outlook in the U.S. Strong economic data suggest corporate fundamentals will remain solid, and the U.S. Federal Reserve will be able to provide a backstop of rate cuts should economic growth slow.
- Attractive current yields. While current spread levels are tight, yields for IG corporate bonds offer a compelling opportunity for investors to lock in long-term income and total return potential. Despite sitting slightly off their October 2023 peak, yields for U.S. IG corporate bonds remain above 5% and are nearly 160 basis points above their 10-year average.
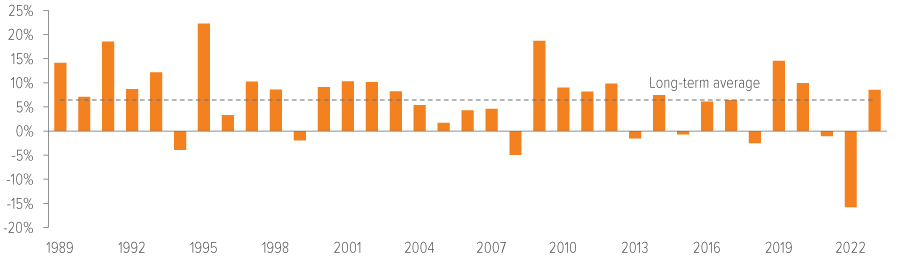
- A good backdrop for long-term return potential. There is a strong correlation between starting yield and future returns (Exhibit 1)—which is notable given current yield levels in the U.S. investment grade corporate bond market. It’s easy to forget the important role that income plays in long-term total returns for bonds, given that rates were so low for so long.


As of 12/31/23. Source: Bloomberg. Chart shows rolling periods from 1989 to 2023. Information shown is for the Bloomberg U.S. Corporate Index. See back page for index definitions.
The higher yield earned on today’s bonds will likely serve as an extra cushion against price deterioration if rates continue to rise or if spreads move wider. Our research shows that, historically, as rates increase to more normalized levels, the negative impact of additional rate moves higher starts to wane—and this is the environment we are in today. Furthermore, given the solid growth environment and an increase in expectations for Fed rate cuts in 2024, investment grade spreads are tight, with the option-adjusted spread (OAS) of the Bloomberg U.S. Corporate Index sitting at 96 basis points as of Jan. 31, 2024. The index could absorb an 85-basis-point increase in its yield and investors would still break even, meaning that the income generated would fully offset the decline in price.
Exhibit 2 shows our analysis of different scenarios to illustrate how IG credit may perform in different spread and rate environments.
- Our base case for 2024 is for spreads to trade in a fairly tight range and for the Fed to begin cutting in the back half of the year, which would produce a total return of 7.78% (scenario 1).
- Should spreads tighten further and rates continue to improve, IG would see total returns of over 10% (scenario 2).
- Should economic growth slow further than expected and spreads widen materially, a decline in rates would still outweigh the negative impact of wider spreads and produce total returns of 6.89% (scenario 3).
- And if both rates moved higher and spreads wider, investors would still achieve 1.85% in total returns for IG (scenario 4).
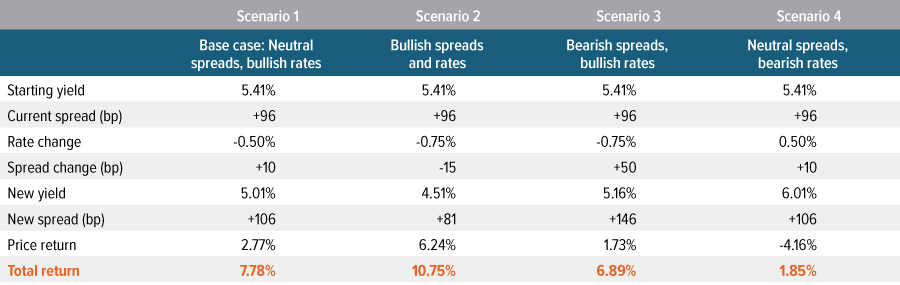
As of 2/28/24. Source: Bloomberg. Calculations are based on the Bloomberg U.S. Corporate Index current duration of 6.9 years and assume immediate parallel shift in yield curve (with the new yield then earned for the 12-month period). Investors cannot invest directly in an index.
A key reason to own investment grade corporate bonds is to diversify equity and lower-rated credit risk. While that assumption didn’t hold up well in 2022, the great news for fixed income investors is that interest rate normalization has returned us to a world in which income is a meaningful component of return. Furthermore, with U.S. growth rates expected to outpace global growth rates, the U.S. investment grade market provides an attractive opportunity for investors seeking a high-quality asset class that can benefit from a strong fundamental backdrop. The expectation for a recession in 2023 led management teams to shore up balance sheets, leaving corporate fundamentals on solid footing heading into an improved economic outlook for 2024. Additionally, while the asset class has seen record new issuance to start the year, spreads have tightened slightly amid exceptional demand for U.S. IG from investors seeking high-quality yields. Against this backdrop, we believe that U.S. investment grade corporate bonds remain an appealing asset class that can provide strong, long-term risk-adjusted returns and diversification in investors’ portfolios.
What’s the long-term case for U.S. investment grade credit?
In a diversified portfolio comprising stocks, bonds, cash and alternative investments, the fixed income allocation can—for most investors—help protect capital in volatile periods and provide a reliable source of income over time.
During the prior decade of low interest rates, many investors felt they needed to increase credit risk so they could protect principal while generating sufficient yield and income. But today, with interest rates having risen materially, higher-rated, lower-risk segments of fixed income such as U.S. IG corporates are now offering higher all-in yields. That means investors have less need to sacrifice credit quality in pursuit of returns. In addition, U.S. IG corporates can offer attractive diversification benefits, thanks to their low correlations with equities and riskier segments of the fixed income market (such as high yield bonds and bank loans).
We see several reasons for investors to consider allocating to U.S. IG credit:
- Financial stability: To qualify as investment grade, an issuing company must receive a credit rating of between Aaa and Baa3 from Moody’s or AAA and BBB- from Standard & Poor’s. As Exhibit 3 demonstrates, the relative financial stability of these companies has helped the U.S. IG corporate segment generate long-term positive returns through multiple credit cycles.
- Size and liquidity: U.S. IG corporate debt is one of the largest and most liquid markets in the world, having tripled in size since 2007 to stand at $7.0 trillion as of Dec. 31, 2023 (Exhibit 4).
- Relative value: The size and scope of the market may offer investors relative value opportunities and inefficiencies that may be captured via active portfolio management. We believe active management, driven by rigorous fundamental analysis and a keen awareness of how corporate management teams respond through various stages of the credit cycle, is key to exploiting these inefficiencies and generating consistent potential performance while mitigating downside risk.
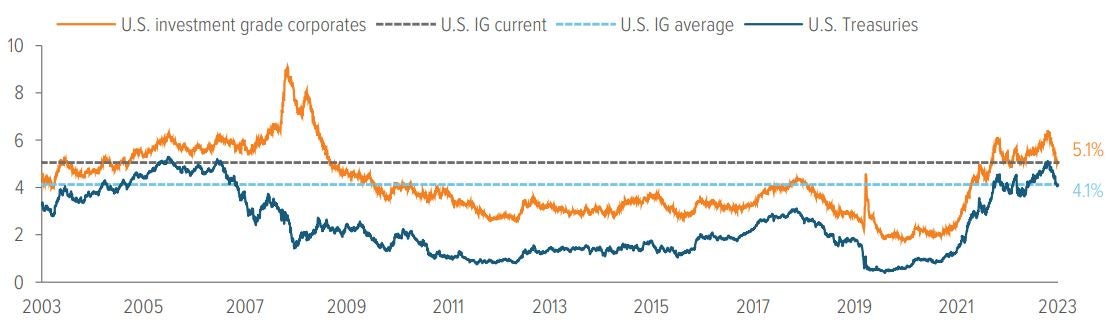
- Attractive pricing: U.S. IG corporate debt yields are above their long-term average (Exhibit 5). Higherquality, lower-risk assets such as U.S. IG corporates may help investors meet their yield requirements without needing to take undue credit risk in lower-rated segments of fixed income.
As of 12/31/23. Source: Bloomberg. Investment grade bonds are represented by the Bloomberg U.S. Corporate Index. See back page for index definitions.
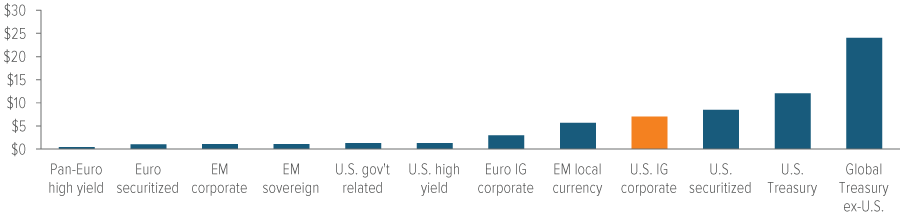
As of 02/28/24. Source: Bloomberg. Pan-Euro High Yield: Bloomberg Pan-European High Yield Index; EM Corporate: Bloomberg EM USD Corporate & Quasi-Sovereign Index; Pan-Euro Securitized: Bloomberg Pan-European Securitized Index; U.S. High Yield: Bloomberg U.S. High Yield Index; U.S. Gov’t Related: Bloomberg U.S. Government Related Index; EM Sovereign: Bloomberg USD EM Sovereign Index; Pan-Euro IG Corporate: Bloomberg Pan-European Corporate Index; U.S. IG Corporate: Bloomberg U.S. Corporate Index; EM Local Currency: Bloomberg EM Local Currency Government Index; U.S. Securitized: Bloomberg U.S. Securitized Index; Pan-Euro Treasury: Bloomberg Pan European Treasury Index; U.S. Treasury: Bloomberg U.S. Treasury Index; Asia Pacific Treasury: Bloomberg Asia Pacific Treasury Index. See back page for index definitions.
As of 12/31/23. Source: Bloomberg Index Services Limited, Voya IM. U.S. IG Corporate: Bloomberg U.S. Corporate Index; U.S. Treasuries: Bloomberg U.S. Treasury Index. See back page for index definitions.
As of 12/31/22. Source: S&P Global Ratings research, S&P Global Market Intelligence’s CreditPro®.
While the breadth of the market and the yields available can look compelling, on their own, U.S. IG corporates also possess several features that may help investors mitigate downside risk.
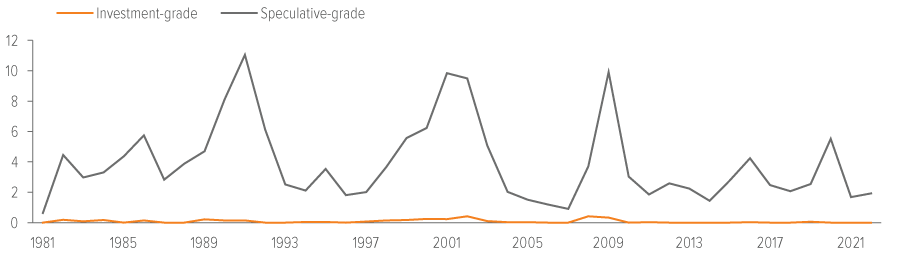
First, U.S. IG corporate bonds have generally been a relatively safe asset class over time. As Exhibit 6 shows, corporate defaults within U.S. IG credit have been infrequent and minimal over time compared with other credit-sensitive asset classes.
Given the minimal default risk over time, one key risk in the IG corporate market is idiosyncratic downgrade risk. While companies being downgraded to below investment grade (so-called “fallen angels”) is a relatively rare occurrence, a passive approach to investing in the IG corporate market may expose investors to this unnecessary additional downgrade risk, which is a key driver of spread volatility. Active managers aim to manage downgrade risk through credit selection—meaning that active strategies, unlike passive strategies, may be able to avoid certain downgrades.
Second, a dedicated U.S. IG corporate sleeve can serve as an effective diversification tool. As Exhibit 7 shows, the asset class has historically demonstrated low correlation to both equities and U.S. Treasuries, as well as riskier segments of the fixed income market—such as emerging market debt, high yield bonds and leveraged loans.
Third, as shown by Exhibit 8, U.S. IG corporate bonds have historically delivered compelling risk mitigation during periods of significant market stress.
Looking at market returns in crisis periods over the last 20-plus years, the U.S. IG corporate market outperformed senior bank loans and U.S. stocks during the dot-com crash, the 2008 financial crisis, the European sovereign debt crisis, the 2015 energy crisis, the U.S. Federal Reserve’s 2018 hiking cycle and the Covid-19 pandemic. Even allowing for a rebound year following each crisis, total returns for the U.S. IG corporate market through all the combined crisis and rebound years exceeded those of the aforementioned markets.
U.S. IG corporates did underperform U.S. high yield bonds in five of the six crisis-and-recovery periods, but the underperformance across all periods was a modest 7% (cumulative). When accounting for the significantly lower volatility profile (a standard deviation of 1.74% vs. 2.70%), the underperformance versus high yield does not look too drastic.
Perhaps even more surprising is that over same periods of crisis and recovery, U.S. IG corporate bonds delivered a better outcome than U.S. Treasuries, a typical safe haven during volatile periods when investors are looking to conserve capital.
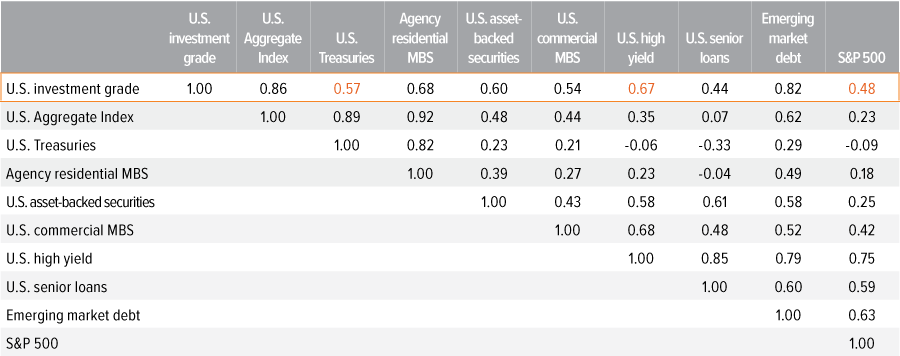
As of 12/31/23. Source: Bloomberg. Correlation of monthly total returns. U.S. investment grade: Bloomberg U.S. Corporate Index; U.S. Aggregate Index: Bloomberg U.S. Aggregate Index; U.S. Treasuries: Bloomberg U.S. Treasury Index; Agency residential MBS: Bloomberg U.S. Mortgage-Backed Securities Index; U.S. asset-backed securities: Bloomberg U.S. Asset-Backed Securities Index; U.S. commercial MBS: Bloomberg U.S. CMBS Investment Grade Index; U.S. high yield: Bloomberg U.S. High Yield Index; U.S. senior loans: Morningstar LSTA Leveraged Loan Index; Emerging market debt: J.P. Morgan EMBI Diversified Index; S&P 500: S&P 500 Index. See back page for index definitions.
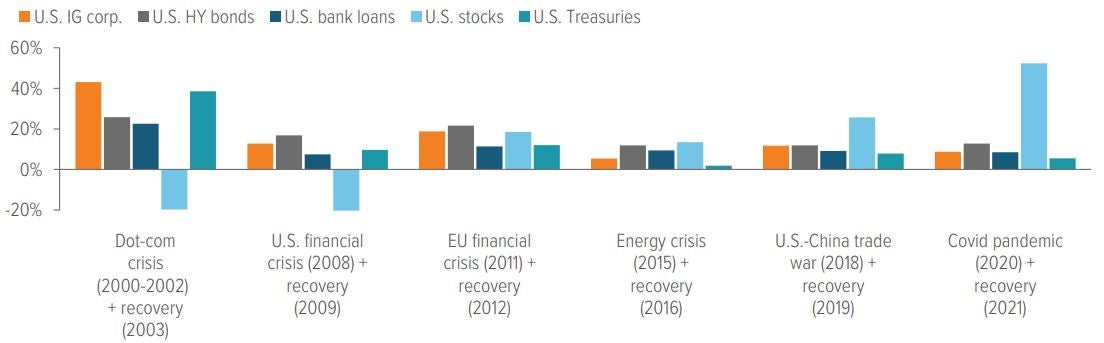
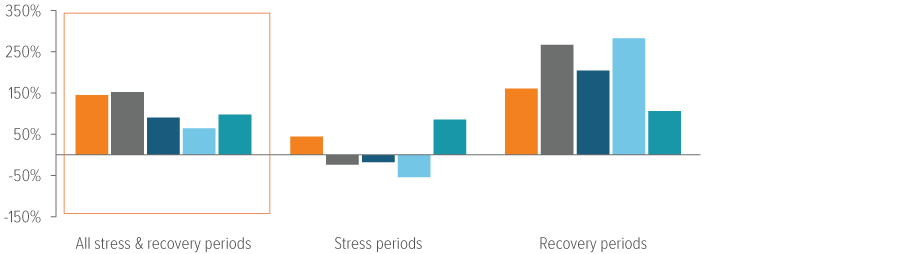
As of 12/31/22. Source: Bloomberg, and Voya IM. Periods covered correspond to the chart above. Stress periods: 2000-2002, 2008, 2011, 2015, 2018, 2020. Recovery periods: 2003, 2009, 2012, 2016, 2019, 2021. Crisis/recovery/stress years shown are estimated and include 12 months of data (from Jan-Dec) for each of the years shown. U.S. investment grade corporate bonds: Bloomberg U.S. Corporate Index; U.S. high yield bonds: Bloomberg U.S. High Yield Index; U.S. bank loans: Morningstar LSTA Leveraged Loan Index; U.S. stocks: S&P 500 Index; U.S. Treasuries: Bloomberg U.S. Treasury Index. See back page for index definitions.
The bottom line: U.S. IG bonds are an appealing asset class
We believe that, under current market conditions, U.S. investment grade corporate bonds may be an appealing asset class.
Years of low interest rates may have tempted many investors into lower-rated parts of fixed income in pursuit of yield, but with rates having risen materially, U.S. IG corporate debt is arguably more attractively priced today than it has been for more than a decade. Additionally, with an improved U.S. economic outlook for 2024, solid corporate fundamentals, and the prospect of Fed rate cuts later in the year, U.S. IG corporate debt is well positioned to provide strong, long-term risk-adjusted returns and diversification in investors’ fixed income portfolios.
Risks of investing The principal risks are generally those attributable to bond investing. Holdings are subject to market, issuer, credit, prepayment, extension and other risks, and their values may fluctuate. Market risk is the risk that securities may decline in value due to factors affecting the securities markets or particular industries. Issuer risk is the risk that the value of a security may decline for reasons specific to the issuer, such as changes in its financial condition. |