Resilience Amidst A Disinflationary Pause And Labor Market Softening

Barbara Reinhard, CFA
CIO, Multi-Asset Strategies and Solutions

Key Takeaways
Softening labor market doesn’t indicate recession
While consumer spending remains stable, the U.S. labor market is showing signs of softening, which may reduce demand-driven inflation, but we don’t think it signals an impending recession.
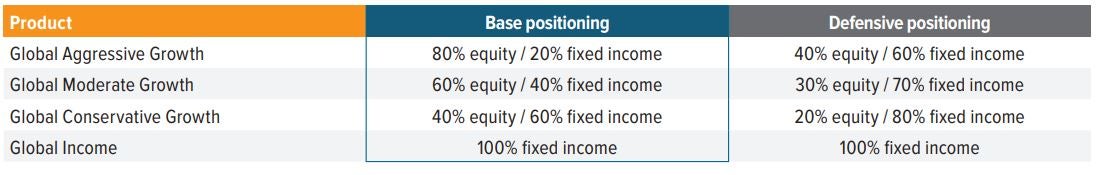
GP portfolios maintain base allocations
With U.S. corporate earnings remaining positive, we maintained our Global Perspectives portfolios at base positioning in early April.
Support for U.S. equities persists
Favorable economic conditions and strong earnings momentum could underpin a broadening rally into value-oriented and smaller cap names and continued strength in U.S. equities overall.
While consumer spending remains stable amid a softening labor market, U.S. corporate earnings remained positive, maintaining our base positioning in our Global Perspectives portfolios.
First quarter 2024 review
U.S. stocks enjoyed a strong first quarter as economic growth and corporate earnings beat expectations. Large caps drove the S&P 500 Index to record-setting highs during the period. The communication services, energy and information technology sectors led, while real estate and utilities lagged. Large-cap stocks outperformed small caps and growth beat value. The Federal Open Market Committee voted to hold interest rates steady for the fifth consecutive time at its March meeting, although three rate cuts are still expected this year, with the first forecasted in June.
Foreign stocks were positive but trailed the U.S. Within developed markets, Euro area and U.K. economic growth remained weak but expected monetary easing generally supported stocks. The Bank of Japan raised interest rates for the first time in 17 years, as the county begins to emerge from a decade long deflationary lull and sees the Nikkei 225 Index to a new high after 35 years. Emerging markets lagged. India performed well, benefitting from U.S. corporations’ efforts to move Asian operations out of China. Subsequently, China moved lower during the quarter, but a late rally caused some to wonder if the bottom is in.
U.S. bonds slipped as the U.S. Treasury yield curve rose, with the 10-year yield increasing to 4.20% by quarter end on early concerns that lingering high inflation could change the Fed’s rate cut plans. High yield and emerging market debt performed best with modestly positive performance.
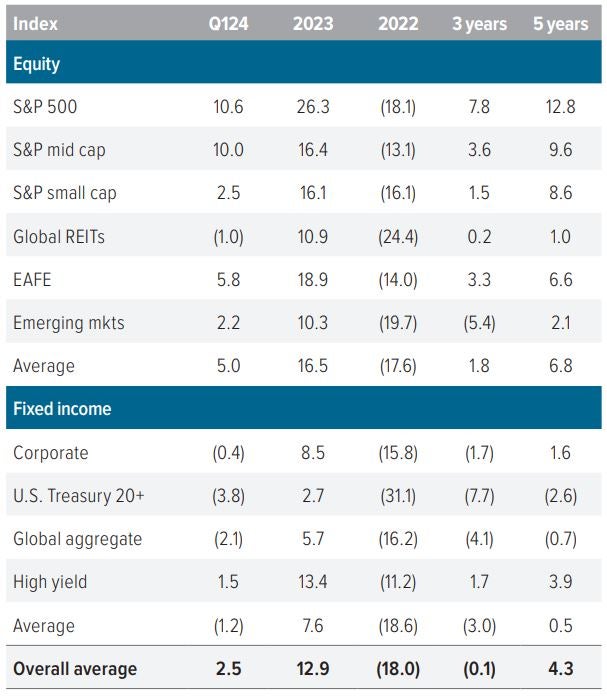
As of 3/31/24. Source: FactSet, FTSE NAREIT, Voya Investment Management. The overall average model allocation includes 10 asset classes, equally weighted: S&P 500, S&P 400 Midcap, S&P 600 Smallcap, MSCI U.S. REIT Index/FTSE EPRA REIT Index, MSCI EAFE Index, MSCI BRIC Index, Bloomberg Barclays U.S. Corporate Bonds, Bloomberg Barclays U.S. Treasury Bonds, Bloomberg Barclays Global Aggregate Bonds, Bloomberg Barclays U.S. High Yield Bonds. Returns are annualized for periods longer than one year. Past performance is no guarantee of future results. An investment cannot be made in an index.
U.S. economy—Resilience amidst a disinflationary pause and labor market softening
The U.S. economy remains resilient as real GDP expanded 2.5% in 2023 due to payroll and productivity gains, which more than offset the effects of Fed tightening. We think economic growth will moderate closer to trend but stay strong in 2024. U.S. and global manufacturing activity is picking up (Exhibit 2).
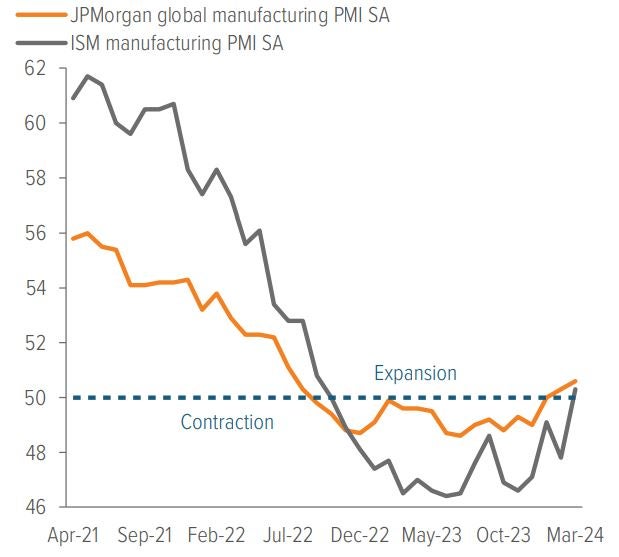
As of 3/31/24. Source: Bloomberg, Bureau of Labor Statistics, Voya IM.
Consumer spending momentum appears to be stable, supported by household net worth that has risen by an astounding $39.3 trillion (equivalent to 140% of GDP) since the pandemic. Also, the U.S. labor market continues to be strong overall but is showing signs of softening. Firms are hiring fewer workers, the unemployment rate has been trending higher, payroll growth is solid but slowing. Quits have also declined and are now below pre-pandemic levels (Exhibit 3). We don’t think this loosening portends an impending recession but could lessen stickier demand-driven inflation.
Although inflation has fallen to more manageable levels—core PCE inflation declined 14 consecutive months to 2.8% in February—concerns about overheating persist, as headline CPI has stopped falling (Exhibit 4). Disinflation, from alleviated supply chain constraints and goods price declines, has faded while core services (ex-housing) prices are still rising.
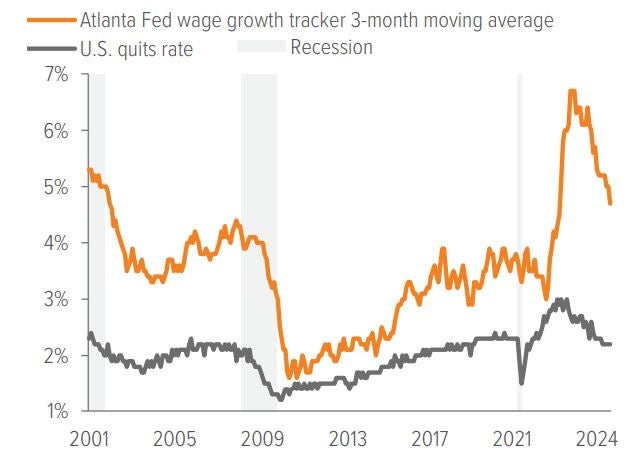
As of 3/31/24. Source: Bloomberg, Bureau of Labor Statistics, Voya IM.
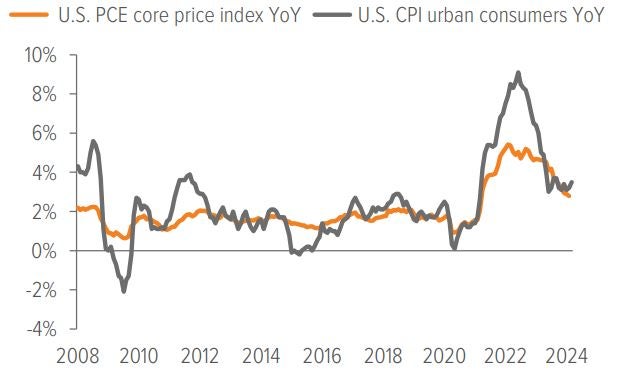
As of 3/31/24. Source: Bloomberg.
To achieve inflation near the Fed’s 2% target, we think downshifting growth and further loosening of the labor market are necessary. This doesn’t mean the economy needs to weaken significantly, but rates may stay higher longer than some participants expect. Fed funds futures have moved from pricing in seven to two 25 bps cuts this year. This expectation is now below the Fed’s projections, which at its March meeting maintained expectations for three cuts this year despite lifting its outlook for inflation and growth.
In our opinion, the number of cuts is less important than the rationale and economic data, which will ultimately dictate policy. The Fed’s broader view of the economy and its longer-term guidance for the path of interest rates should persist if the inflation and employment data cooperate.
The U.S. has the most dynamic, innovative, and resilient economy in the world. It shows pockets of acceleration in the housing and manufacturing sectors, healthy consumers, higher corporate profits and shifting monetary policy. Although concerns about inflation and over concentration in the equity markets persist, the macro backdrop is overwhelmingly positive and underpins our belief that the risk asset rally may broaden out, justifying our continued home country bias.
4Q23 S&P 500 corporate earnings stay positive— GP portfolios remain in base allocations
S&P 500 fourth-quarter earnings grew by 10.1% yearover-year, with eight of the 11 sectors showing yearover-year increases. Communication services and consumer discretionary sectors led the way, with earnings rising by 53.4% and 36.5%, respectively, compared to a year ago. Energy, materials and healthcare earnings declined during the period. In aggregate, earnings came in better than expectations with 76% of companies beating. With U.S. corporate earnings positive again, Global Perspectives portfolios remain in base positioning (Exhibit 5).
U.S. equities—Expect the rally to broaden on favorable economic conditions and strong earnings momentum
In addition to the economic environment, U.S. stocks are supported by strong earnings momentum that could continue throughout the year. We think earnings will continue to grow faster than consensus (Exhibit 6) driven by healthy sales volumes aided by the ongoing resilience of consumer spending and durable margins underpinned by robust corporate pricing power and meticulous cost cutting.
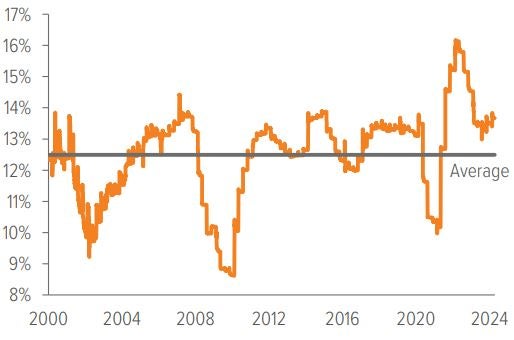
Valuation is always an important factor to consider. While U.S. large cap earnings multiples continue to expand well beyond long-term averages, growth and quality of earnings justifies a premium. Using the price/ earnings to growth ratio (PEG), mega-cap tech stocks are cheaper than the broader S&P 500. We recognize breakneck growth rates can’t last forever, but if U.S. tech firms turn into entrenched global artificial intelligence (AI) monopolies, increasing global market capitalization share is possible. However, a broadening rally, as value-oriented and smaller cap segments of the market take the lead, is more likely for the rest of the year. With the buoyant economy, rising corporate profits and pivoting monetary policy, cyclical stocks look poised to benefit from a prolonged mid-cycle expansion. To take position for these developments and reduce tech sector concentration risk, we have increased our allocation to U.S. mid cap equities and reduced our overweight to U.S. large cap equities. Overall, the economic soft landing and looser financial conditions coupled with anticipated rate cuts create favorable conditions for U.S. stocks. Although stock prices have appreciated significantly and a near-term pullback looks increasingly likely, the accumulation of cash in money market funds points to the potential for a further rally once the Fed reduces rates.
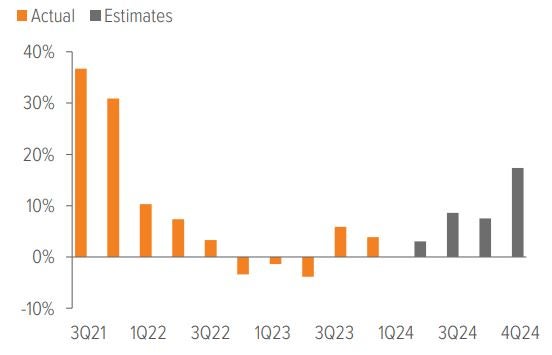
As of 4/2/24. Source: FactSet.
Bonds—Strong fundamentals should contain high quality spreads allowing investors to keep more carry
In 1Q24, bond yields drifted higher on the back of stronger-than-expected economic growth and hotterthan-forecasted inflation. While higher longer-end rates make duration more attractive and provide a good entry point for fixed income investors, we are maintaining our neutral duration posture and think an up-in-quality overweight to credit remains the best risk-adjusted bet. The U.S. macroeconomic backdrop, where strong earnings suggest solid corporate fundamentals and tight spreads, continues to support investment-grade credit. Even if spreads widen later this year, we think the move will be limited and carry will keep total returns positive.
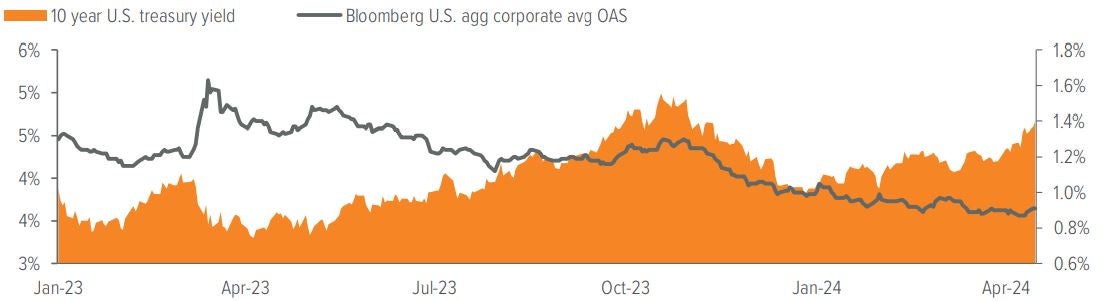
As of 4/15/24. Source: Bloomberg, Left axis shows the 10-year treasury yield. Right axis shows the investment grade as represented by the Bloomberg U.S. Aggregate index corporate average option adjusted spread.
A note about risk Certain of the statements contained herein are statements of future expectations and other forward-looking statements that are based on management’s current views and assumptions and involve known and unknown risks and uncertainties that could cause actual results, performance or events to differ materially from those expressed or implied in such statements. All investments are subject to market risks as well as issuer, credit, prepayment, extension, and other risks. The value of an investment is not guaranteed and will fluctuate. Actual results, performance or events may differ materially from those in such statements due to, without limitation, (1) general economic conditions, (2) performance of financial markets, (3) interest rate levels, (4) increasing levels of loan defaults, (5) changes in laws and regulations and (6) changes in the policies of governments and/or regulatory authorities. |