
International small cap stocks can help round out a global equity allocation, offering growth and diversification potential beyond international large caps and U.S. stocks.
They operate across a wide range of international markets, often serving local and regional economies. Many are based in developed countries with strong local industries, while others benefit from rising demand at home as their economies grow. Because they are often driven by local business conditions rather than global trends, they can behave differently from large U.S. stocks.
While international small cap stocks can experience more ups and downs along the way, their long‑term growth potential and diversification benefits may make them a worthwhile addition to a well‑balanced equity portfolio.
Here are three reasons they have historically stood out relative to international large caps.
1. Stronger long‑term return potential versus international large caps
Over longer time horizons, international small cap stocks have historically outperformed their international large cap counterparts, both on a total return basis and after adjusting for risk. Exhibit 1 provides historical context for this comparison.
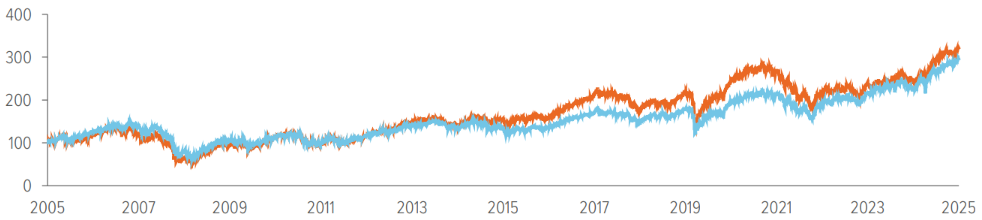
As of 12/31/25. Source: Morningstar, Voya IM. The MSCI EAFE Small Cap Index measures the performance of small-capitalization companies across developed market countries around the world excluding the U.S. and Canada. The MSCI EAFE Large Cap Index measures the performance of large-capitalization companies across developed market countries around the world excluding the U.S. and Canada. Past performance does not guarantee future results. Investors cannot invest directly in an index.

As of 12/31/25. Source: Morningstar. Standard deviation is a formula that predicts potential future volatility of performance. High deviation suggests the outcome could be very different from historical averages, while low suggests the outcome could be closely matched. The Sharpe ratio measures risk-adjusted return, or how much excess return is received in exchange for the extra volatility associated with investing in a riskier asset.
For investors, this combination can matter. Shifting a portion of an international allocation from large caps to small caps has historically been associated with increased upside potential without materially changing how the portfolio behaves alongside U.S. equities.
Importantly, this higher return potential has not come at the cost of diversification. International small caps have shown similar correlations to U.S. large cap stocks as international large caps, meaning they have provided comparable diversification benefits within global equity portfolios.
2. Small caps have found greater success outside the U.S.
Size premium refers to the tendency for smaller companies to deliver higher returns over time, reflecting their higher growth potential and greater sensitivity to economic change.
In the U.S. market, this effect has been less consistent in recent years. Large companies have benefited from scale, access to capital, and strong investor demand, narrowing the historical return gap between small and large firms.
International markets have looked different. Over long periods, international small caps have generated positive excess returns relative to international large caps, while the same comparison in the U.S. has been less favorable for small companies.
Exhibit 2 captures that contrast directly. Each line measures how small companies have performed relative to large companies within their respective market: the U.S. on one hand, international developed markets on the other. When a line is above zero, small companies are outpacing large ones. When it falls below zero, large caps have the edge. In the U.S. the extraordinary rise of mega-cap technology companies created an unusually difficult environment for small caps—a dynamic that reflects this particular market cycle. Internationally, small companies have held a more consistent performance edge over large ones across most of the past two decades.
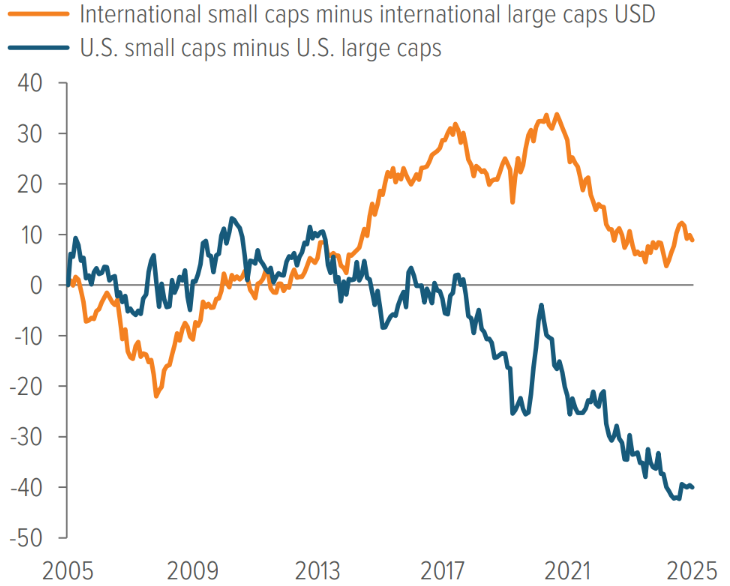
As of 12/31/25. Source: Morningstar, Voya IM. International small cap stocks represented by the MSCI EAFE Small Cap Index, which measures the performance of small cap stocks across 21 developed market countries, excluding the U.S. and Canada. International large cap stocks represented by the MSCI EAFE Index, which measures the performance of large and mid cap stocks across those same developed markets. U.S. small cap stocks represented by the Russell 2000 Index, which measures the performance of the small-cap segment of the U.S. equity universe. U.S. large caps represented by the Russell 1000 Index, which measures the large-cap segment of the U.S. equity universe. Past performance does not guarantee future results. Investors cannot invest directly in an index.
One possible reason for this difference is the composition of international small cap markets. On average, international small cap indexes include a higher share of companies that are already profitable, as measured by return on equity (Exhibit 3). Many of these companies, particularly in developed markets, operate in strong local industries, maintain more disciplined financial structures, and rely less on speculative growth strategies. In emerging markets, smaller companies may also benefit from faster economic growth and rising domestic demand.
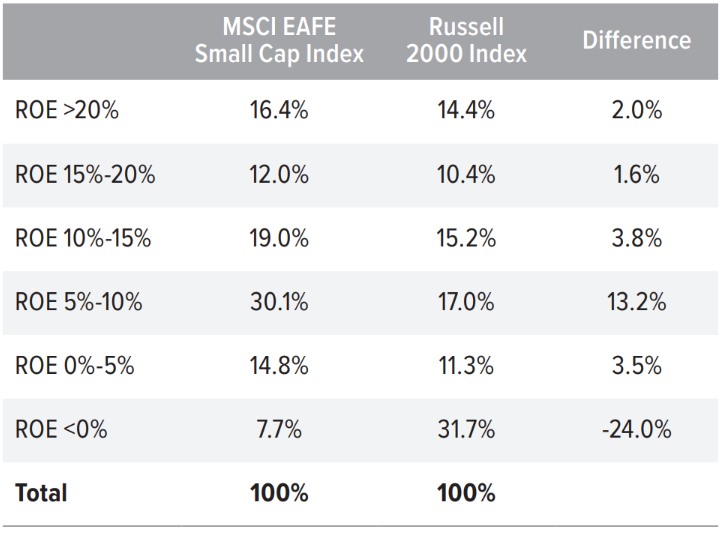
As of 12/31/25. Source: FactSet, Voya IM. Past performance does not guarantee future results. Investors cannot invest directly in an index.
For investors, this helps put those regional differences into context—and illustrates why international markets have offered a different backdrop for small cap exposure.
3. Different starting prices for international small and large caps
For investors who care about diversification, what you pay can matter just as much as what you own.
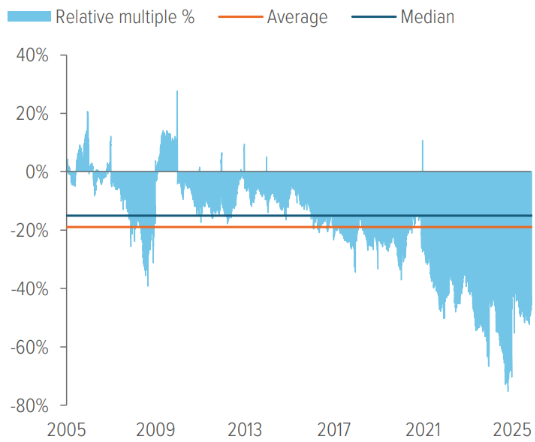
International small‑company stocks are cheap compared with the past. Compared with large international companies, small international companies are trading at lower-than-average prices (Exhibit 4). This means investors are paying less for each dollar of earnings from smaller international companies than they typically have, and less than they pay for larger companies.
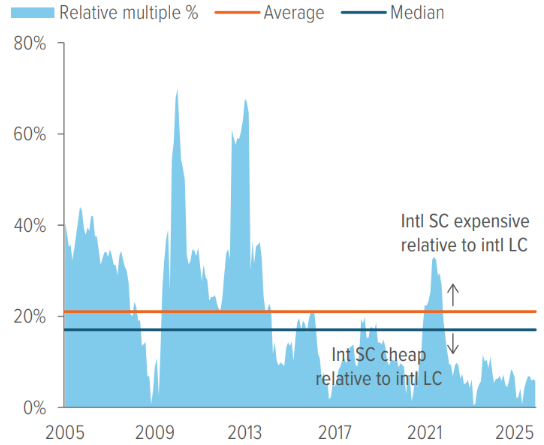
When differences like this have shown up in the past, they’ve often reflected periods when smaller companies were out of favor—not because their businesses were weaker, but because investor attention was focused elsewhere. As conditions change, these pricing differences have tended to normalize over time.
Investing at a lower price can offer investors a margin of safety. It doesn’t eliminate risk, but it can help soften losses and improve long term results as prices move back toward more typical levels.
This same idea applies beyond company size. International stocks more broadly are also cheaper than U.S. stocks at the moment. Exhibit 5 compares international and U.S. equities using a forward price to earnings ratio, which looks at how much investors are paying today for the earnings companies are expected to generate over the next year.
As of 12/31/25. Source: Bloomberg Index Services, Ltd., FactSet, Voya IM. The MSCI EAFE Index captures the performance of large and mid cap stocks across 21 developed market countries, excluding the U.S. and Canada. The S&P 500 Index measures the performance of about 500 of the largest U.S. companies. Next 12 months (NTM) price-to-earnings (p/e) ratio is the ratio of a company’s share price to its earnings using projected future financial performance for the next 12 months (rather than historical data), which can help determine whether a stock is under- or overvalued. Past performance does not guarantee future results. Investors cannot invest directly in an index.
Putting it all together
Investing in international small cap equities can help broaden global equity exposure. Over time, they have been influenced by different return drivers, regional factors, and company characteristics than international large caps and U.S. equities. As a result, they can play a complementary role within a diversified portfolio that includes U.S. large caps, international large caps, and other small cap exposures.
Like all equity investments, international small caps carry risk and may experience periods of volatility. Over time, their role within global markets may help investors diversify and access a wider range of growth opportunities.
A note about risk: All investing involves risks of fluctuating prices and the uncertainties of rates of return and yield inherent in investing. The principal risks are generally those attributable to investing in stocks and related derivative instruments. Holdings are subject to market, issuer and other risks, and their values may fluctuate. Market risk is the risk that securities or other instruments may decline in value due to factors affecting the securities markets or particular industries. Issuer risk is the risk that the value of a security or instrument may decline for reasons specific to the issuer, such as changes in its financial condition. Smaller companies may be more susceptible to price swings than larger companies, as they typically have fewer resources and more limited products, and many are dependent on a few key managers. International investing does pose special risks, including currency fluctuation, economic and political risks not found in investments that are solely domestic. Risks of foreign investing are generally intensified for investments in emerging markets.