Fixed Income Perspectives: The Battlefront Over Labor Data

Head of Multi-Sector Fixed Income

Amid speculation that economic data might become politicized, one thing hasn’t changed: it still demands context, perspective, and a long-term view beyond the next headline.
Don’t talk about politics at the data table
Recent headlines have fanned speculation that economic data faces the risk of becoming politicized or privatized. There are practical reasons why such an extreme outcome is unlikely. For one, the private sector simply cannot match the breadth of the government’s data-gathering effort (which already includes private-sector data).
However, concerns over data reliability reinforce an important point about the current market backdrop: it is simply another factor adding to the uncertainty already shaping fixed income markets. A more immediate issue than data bias is that underresourced agencies may require more time to ingest and interpret the incoming information. That means the possibility of wider swings in subsequent revisions, like what we recently saw in labor market data.
U.S. labor enters a cautious phase
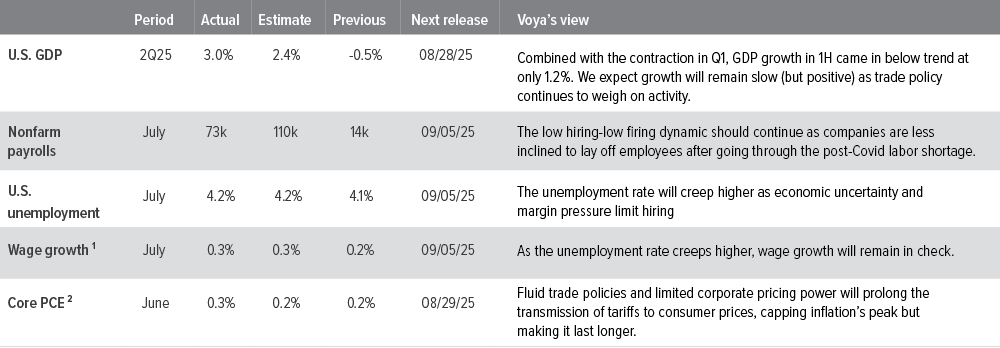
Recent jobs data is a reminder that the headline unemployment rate often masks important underlying shifts. The 144,000 and 147,000 private-sector payroll gains in May and June were revised down to just 19,000 and 14,000, respectively, mirroring the broader pattern of negative adjustments across major industries. Construction employment is flattening, manufacturing remains a drag, and recent gains in state and local government hiring have started to reverse.
One of our key themes for the second half of 2025 is a “low hiring, low firing” labor market environment. Employers’ recent experiences during the Covid shutdown (and subsequent bounce back shortly after) have made them reluctant to let workers go amid the current policy uncertainty. There’s no sign yet that we’re headed toward a mass-layoffs phase of a labor market breakdown, but underlying tremors are becoming more evident, particularly at the margins.
This labor data challenges the Fed’s “wait and see” stance, and the market has adjusted its expectations for a September rate cut from 40% to 80% following the downward revisions.
What’s really going on in the labor market?
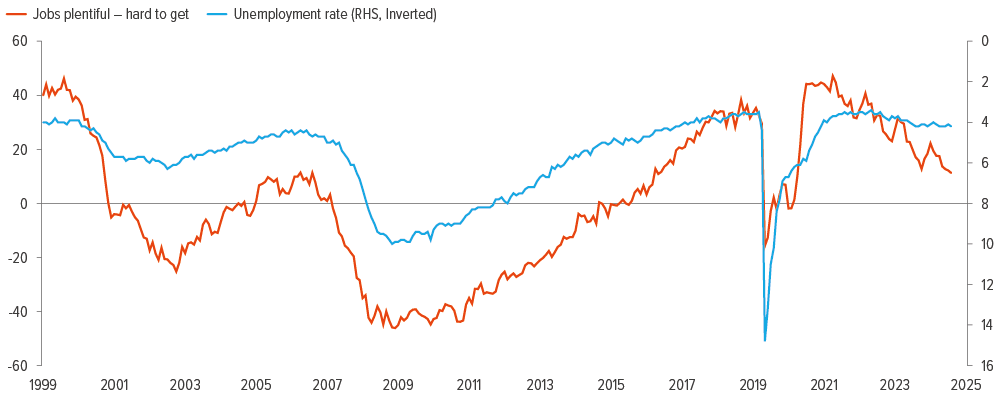
One tip for getting past the noise about recent data is to focus on is the “jobs plentiful versus hard to get” ratio. It’s basically the gap between people who say jobs are easy to find and those who say they aren’t. Usually, this ratio moves directionally with the unemployment rate. But since 2022, the falloff has been much steeper than the gentle downward slope of unemployment—and it’s become increasingly noteworthy (Exhibit 1).
One interpretation is that the labor market is softer than the headline unemployment rate suggests. In other words, the unemployment rate should be a lot higher than it is, a reminder to look beyond the surface when assessing the labor market’s true momentum.
Implications
With corporate credit spreads near multi-decade tights, we continue to favor securitized credit sectors that offer attractive relative value opportunities and income generation potential. On the corporate side, we remain cautious toward lower-quality issuers, where signs of strain are starting to emerge. With spreads failing to fully compensate for that risk, we prefer to stay up the quality spectrum with a bias toward shorter-dated bonds.
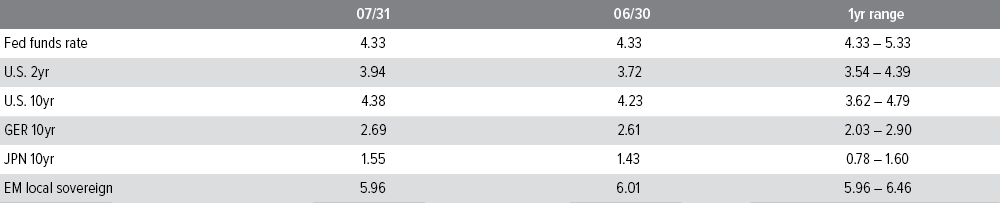
As of 07/31/25. Source: Bloomberg, FactSet, Voya IM.
Source: U.S. Bureau of Labor Statistics
Sector outlooks


- With most of S&P 500 earnings complete, 2Q25 earnings have broadly come in ahead of expectations and are on track for 7.6% year-over-year earnings growth on 5.6% revenue growth.
- July supply of $80 billion was 18% lower than average and below expectations, likely driven by higher rates.
- We continue to keep IG risk low as spreads have moved back to the low end of their historical range given continued solid fundamentals and light supply. From a sector perspective, we prefer financials and utilities over industrials, where we are leaning away from sectors with exposure to M&A risk, trade policy uncertainty.

- We are watching the labor market closely to make sure any weakness doesn’t slow consumer spending and create pressure for high yield issuers.
- From a fundamental perspective, the backdrop is moderating due to policy uncertainty, and the risk of policy error-driven weakness raises the risk for cyclicals.
- The magnitude of uncertainty in the market backdrop favors defensive business models and balance sheets, particularly at compressed spread levels.

- The overall carry should continue to boost performance on both a total return and excess return basis, and we are continuing to pay close attention to the evolving developments on the policy and macro front.
- Demand was again supported by elevated CLO issuance, although retail loan funds saw modest inflows for the month of July.
- The rolling 3-month downgrade-to-upgrade ratio decreased in July to 2.33x (from 3.08x the prior month) but remains elevated.

- Supply for agency mortgages is expected to remain muted for the remainder of 2025 as elevated rates lead to lower cash-out refinancing activity.
- While carry remains attractive, large, fast-money trades continue to have the potential to create volatility in the near term.
- Longer-term, we believe strong fundamentals and a limited new supply backdrop should support mortgage returns going forward.
- Recent spread moves in the securitized market have favored subordinate parts of the capital structure, a characteristic of risk-on markets with deep liquidity, and correlated with risk-on moves in other markets.
- Many ABS sub-sectors richened over the course of July, leaving parts of ABS relatively less attractive. Longer duration, high credit quality cashflows may get better reception, although deeper subordinates may struggle to get sufficient sponsorship to drive credit curves any flatter with the lower growth backdrop.
- While CMBS spreads have retraced, CRE fundamentals continue to improve, and the sector remains attractive.
- Strong mortgage credit fundamentals and improved valuations should enable RMBS to overcome pockets of weakness emerging in the housing market.
- Softer technicals in the CLO market could lead to opportunities, where we maintain a bias toward high-quality managers and strong underlying collateral pools.

- Elevated real yields and softer domestic conditions suggest many EM central banks have room to continue cutting rates, but external factors may limit their flexibility.
- Corporate fundamentals remain resilient, and financial policy remains prudent.
- EM corporates are expected to be indirectly impacted by tariffs through global growth, inflation, and commodity prices. We expect direct impacts to be limited.
Glossary of terms OAS: option-adjusted spreads ABS: asset-backed securities CMBS: commercial mortgage-backed securities RMBS: residential mortgage-backed securities CLO: collateralized-loan obligations PCE: personal consumption expenditure YTM: yield to maturity |
A note about risk: The principal risks are generally those attributable to bond investing. All investments in bonds are subject to market risks as well as issuer, credit, prepayment, extension, and other risks. The value of an investment is not guaranteed and will fluctuate. Market risk is the risk that securities may decline in value due to factors affecting the securities markets or particular industries. Bonds have fixed principal and return if held to maturity but may fluctuate in the interim. Generally, when interest rates rise, bond prices fall. Bonds with longer maturities tend to be more sensitive to changes in interest rates. Issuer risk is the risk that the value of a security may decline for reasons specific to the issuer, such as changes in its financial condition.