
Key Takeaways
Competitive pricing
Prices for renewable energy have plummeted and are competitive with fossil fuels, motivating U.S. corporations and utilities to sign power purchase agreements that underpin large-scale renewable projects.
Strong U.S. demand
The United States is expected to represent the largest market for private energy transition investment in the world over the next 3–5 years, with solar, wind, battery storage, transportation electrification and clean hydrogen expected to see significant growth.
Compelling investment opportunity
The long-term cash flows of renewable energy projects can isolate investors from broader market cycle risk and deliver a return stream that is less correlated to other asset classes.
Infrastructure project financing represents a compelling way for investors to access the significant growth potential of the global energy transition.
Dollars and sense: Declining costs make the transition to renewable energy a no-brainer
Demand for renewable power is growing rapidly, as renewable technologies have become more efficient, more reliable, and increasingly competitive with fossil fuels. As governments around the world pursue long-term carbon reduction policies, investments in renewable energy technology and related infrastructure are expected to soar (Exhibit 1).
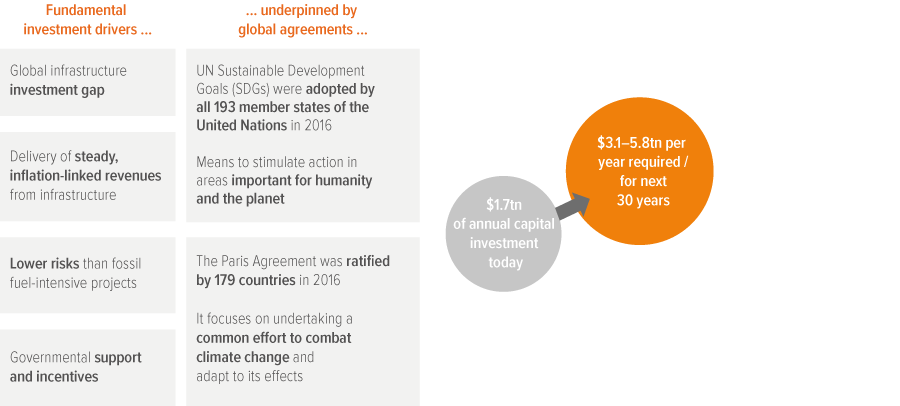
Source: UN Principles for Responsible Investment; UN Development Programme; BloombergNEF New Energy Outlook 2022.
Importantly, public policy to reduce carbon emissions (a politically charged topic in the United States) is not the primary catalyst for surging renewable energy demand. Prices for renewable energy have plummeted and are now competitive with fossil fuels such as oil, gas and coal. Despite the recent uptick in prices over the past year, onshore wind and solar remain the cheapest sources of electricity, a position they have held since 2018 (Exhibit 2). Wind and solar costs are expected to become even more affordable as advances in various efficiencies in lithium-ion batteries continue to reduce storage costs and facilitate renewables penetration. Energy storage facilities help smooth the supply of wind and solar energy across regions and over time, which is an important step towards the wide-scale adoption of renewable energy.
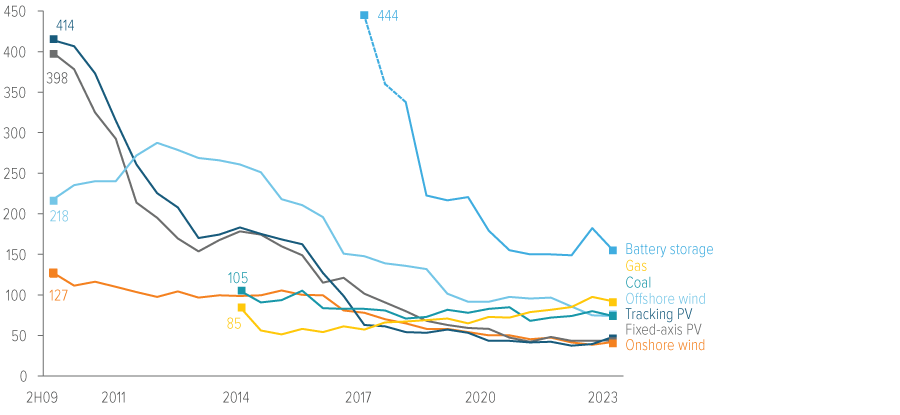
Source: BloombergNEF. The global benchmarks are capacity-weighted averages using the latest country estimates, apart from nuclear, hydrogen and CCS, which are simple averages. Offshore wind includes offshore transaction costs. Coal- and gas-fired power includes carbon pricing where policies are already active. Levelized cost of electricity (LCOE) represents the long-term offtake price that a power plant needs to break even. LCOEs do not include subsidies or tax credits. LCOEs shown by financing date. PV stands for photovoltaics (i.e., solar).
The EPA’s Top 100 Partners use nearly 100bn kWh of green power, equivalent to the electricity use of 9mn homes.
Demand for renewable projects is inelastic
The low cost of renewable energy motivates U.S. corporations and utilities to sign power purchase agreements that underpin large-scale renewable projects. As of July 24, 2023, the combined annual green power use of the EPA’s Top 100 Partners amounts to nearly 95 billion kilowatt-hours, which is equivalent to the annual electricity use of more than 8.9 million average American homes. Companies such as Microsoft, Google, Wal-Mart and AT&T are among the U.S. corporations completing wind, solar and hydrogen power purchase agreements.
In addition to growing demand from corporations, there are currently 37 states with clean energy goals, 22 of which have 100% clean energy requirements. (These include California, New York, Louisiana and Virginia).1
Inflation Reduction Act provides United States with additional boost
The U.S. Inflation Reduction Act is projected to add approximately $369 billion in energy transition programs over the next ten years. Additionally, the act calls for comprehensive permitting reform legislation to be passed, which will help accelerate energy and transmission projects.
Thanks in part to the Inflation Reduction Act, the U.S. is expected to be the largest market for private energy transition investment in the world over the next 3–5 years (Exhibit 3). Renewable energy is still less than 15% of the U.S. power generation fleet, creating a massive opportunity for growth.
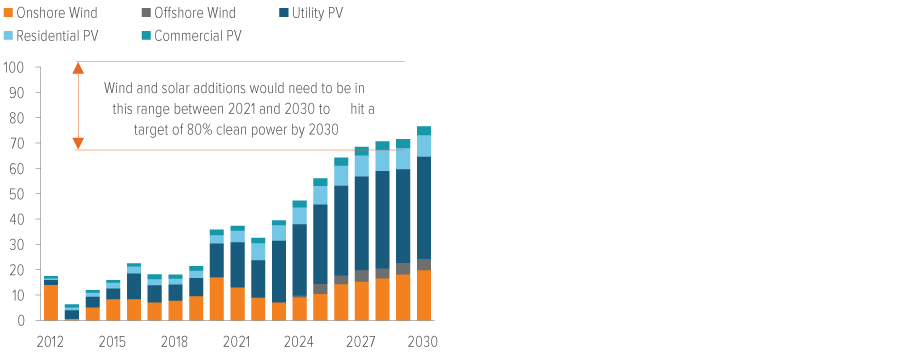
As a result of the Inflation Reduction Act, the U.S. is forecasted to build 600+ gigawatts (GW) of new solar, wind and storage by 2030 (Exhibit 4). This capacity represents two times the current wind footprint, three times the current solar footprint, and nine times the current storage footprint in the United States—all coming despite current challenges with permitting, interconnection and sourcing of equipment and labor.
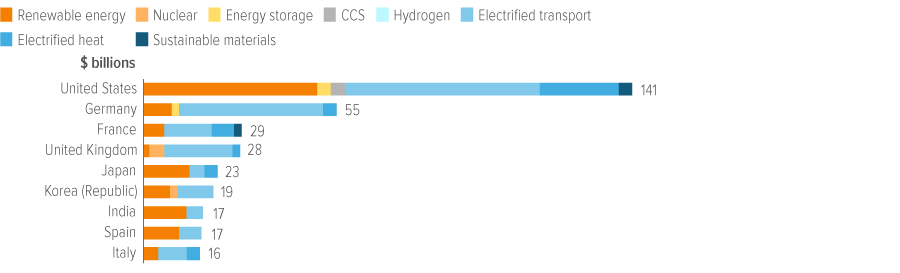
Source: BloombergNEF’s Energy Transition Investment Trends, January 2023.
The opportunity in transportation electrification and clean hydrogen
Transportation electrification and clean hydrogen are two additional areas that are expected to see increased demand from the ongoing energy transition.
Bloomberg New Energy Finance (BNEF) estimates at least 335 million chargers will be built by 2040 to serve approximately 730 million passenger electric vehicles (EVs) and 135 million commercial EVs and electric buses. As of 2022, 14 million chargers had been installed, including 3 million public chargers.2 Charging infrastructure for electric vehicles will require $1–1.4 trillion of investment globally by 2040, with most investment going toward public fast chargers (Exhibit 6). Electrification of buses and light-duty trucks has already begun globally, with room to grow in the U.S.
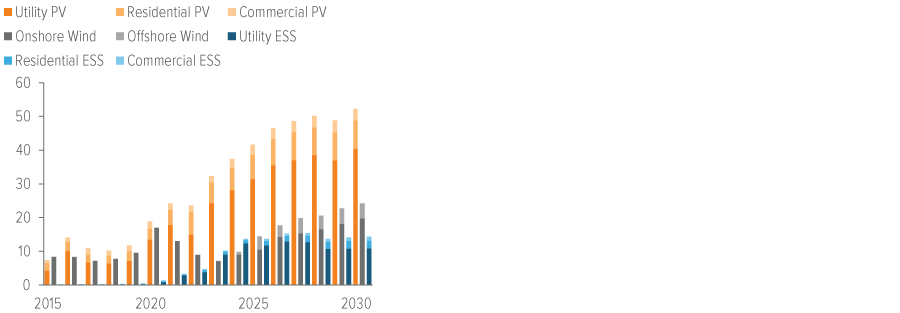
Source: BloombergNEF. Note: ESS refers to energy storage systems. PV refers to photovoltaic.
Meanwhile, clean hydrogen is projected to be a $700 billion market globally by 2030,2 with potential investment opportunities in production, transmission and distribution, and with end-use applications including industrial production and transportation.3 The United States’ 2021 infrastructure bill includes $8 billion for the development of six to ten hydrogen hubs, $1 billion for a clean hydrogen electrolysis program, and $500 million for clean hydrogen manufacturing.
Long-term nature of project cash flows isolates investors from broader market cycle risk
A significant source of current and future demand for renewable energy infrastructure projects is U.S. corporations and utility companies buying power directly from wind and solar projects. As long-term, multi-year contracts, power purchase agreements result in a stable, predictable cash flow for investors, regardless of where we are in the economic cycle. As a result, renewable energy infrastructure projects are expected to have low correlations to the broader economic cycle and other asset classes (Exhibit 5).
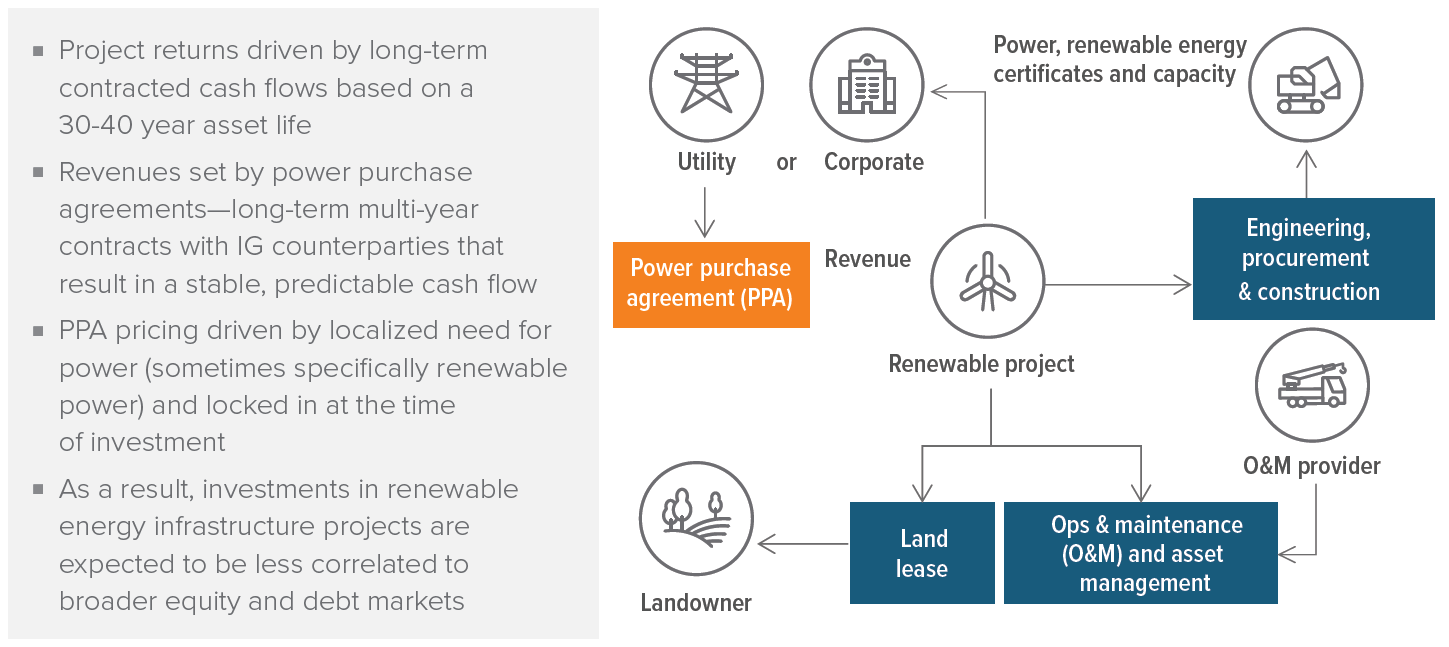
Structure presented for illustrative purposes only, and there can be no assurances that any particular transaction will be structured in a similar manner.
The economics of a project with a fixed revenue agreement (e.g., a PPA) are locked in at the time of investment and are isolated from market movements, including the cost of power in the future. For example, when a utility enters into a PPA, the price it agrees to pay is calculated into its rate base and passed on to the consumer. If power prices decline, that does not affect what the utility can charge its customers for prior projects and does not change what the utility will pay the project under the existing PPA for the project’s future power production.
Corporate PPAs also generate stable cash flows. For example, most corporate purchasers of renewable energy (i.e., the corporate offtakers) are investment grade. However, even in the unlikely event that the corporate purchaser defaults on its obligation to purchase power, it can often be replaced by another party that will purchase power from the same project.
Filling the void: How flexible capital can monetize inefficiencies in project financing
The broad infrastructure category includes projects across electricity, roads, bridges, railroads, airports, water and sewerage. In 2023, renewable energy financing represented roughly 25% of all infrastructure financing activity in the U.S. This market is growing, complex, dynamic and fragmented, which creates financing inefficiencies and opportunities for highly specialized investment managers.
Voya estimates that the opportunity set for renewable energy and sustainable infrastructure debt strategies is ~$51bn per year.4
Exhibit 6 provides an overview of project financing in the renewable energy space. As you can see, there are two types of equity investors in the space. The first type of equity investor assumes more binary risk by investing at the very beginning of a project. This equity investor targets a high IRR at a level that investors typically associate with private equity / venture capital.
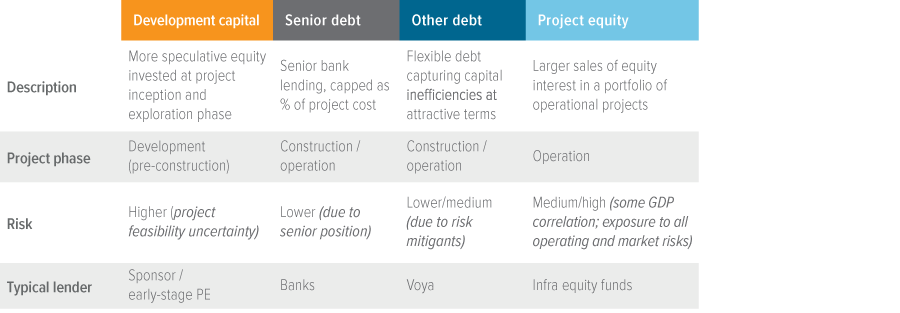
Source: Voya IM. For illustrative purposes only.
As projects progress into construction, the developers and sponsors who provided the initial investment capital typically tap banks for traditional project financing. However, the amount banks can lend is often capped at a percentage of the project’s costs. Meanwhile, the larger institutional infrastructure equity funds—the second (and more common) type of equity investor in the space—invest significantly later in a project, when construction is already complete and the project is in operation. While the risk is lower for these larger equity investors, so are the expected returns, which typically include a long-term (20+ year) view on expected cash flows and residual value of the projects. In addition, these infrastructure equity funds tend to have broader strategies that typically look for investment opportunities where they can make larger commitments than those made by more specialized strategies.
Flexible, highly specialized investment managers can capitalize on this financing inefficiency by devising creative, more efficient financing structures. For example, sponsors and developers often depend on investment managers to originate and structure deals, which allows investment managers to earn upfront structuring and origination fees. In addition, investment managers in this space are often able to negotiate and secure additional yield enhancements through “equity kickers” that improve the return potential for subordinated debt holders. While the specific terms vary on a loan-by-loan basis, equity kickers in renewable energy project loans often allow for the conversion of subordinated debt into equity as the project reaches milestones and successfully progresses through construction into operation.
While we believe the opportunities in this space are significant, barriers to entry are high given the expertise needed to source deals and navigate the complexity of projects. In addition, by targeting deal sizes that are generally too small for larger pools of capital, a manager can negotiate more favorable terms. This makes pure-play renewable energy infrastructure debt strategies difficult to replicate and hard to commoditize.
While there are certain similarities to middle market private credit, renewable energy infrastructure debt is significantly less crowded, and its lower risk profile is compelling for investors seeking diversification from more traditional corporate credit exposure.
Risk profile of project financing: How timing of investment, underlying cash flow and structure help mitigate risk
Voya lends after the development phase of a project is complete
Development risks include:
- Siting risk: The developer must acquire the rights to a site that is suitable and has adequate solar or wind resources to support the economics of the project.
- Permitting risk: Once a site has been acquired, many permitting requirements arise, such as environmental and construction permits. Permits are typically required by different federal, state, county and city jurisdictions. Securing these permits can take years to obtain.
- Interconnection risk: A wind or solar project needs transmission lines to get its power to market. Projects typically need to commission a study from a local utility about feasibility and potential cost of interconnection. A negative outcome of this study can make a project uneconomic.
- Pricing risk: The developer must secure a long-term power purchase or offtake agreement to lock in the project’s revenue (or effectively mitigate its variability), which reduces risk and enables the project to secure the non-recourse financing.
Initial equity investors may have their capital tied up for years as the project attempts to navigate these risks. In the worst-case scenario, these risks can result in a project failing, causing equity investors to lose their entire investment.
Debt financing is invested after the development phase of a project—i.e., when the project has cleared or otherwise mitigated these development risks and is entering construction. By investing after the development phase in projects with proven technology, debt investors are able to mitigate the major risks of renewable energy project financing. Other (lesser) project risks remain, but investors can assess and mitigate these risks on a case-by-case basis (Exhibit 7).
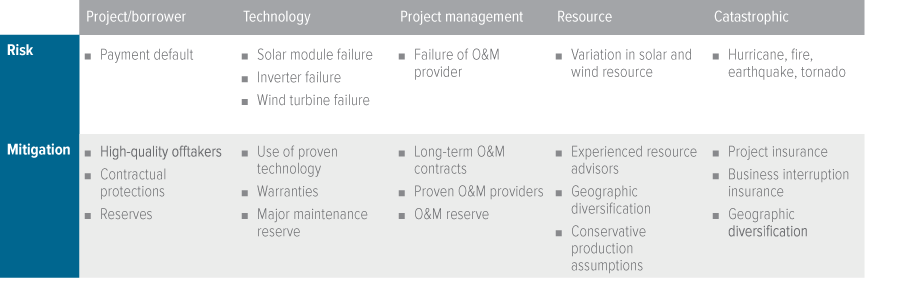
Source: Voya IM. The table above does not purport to be a complete assessment of all risks associated with renewable energy infrastructure investments. There can be no guarantee that the mitigation strategies identified above will successfully mitigate all known and unknown risks. Past performance is no guarantee of future results.
How does renewable energy infrastructure fit into a broader portfolio?
Given the inefficiencies in renewable energy project financing, we believe specialized pure-play renewable debt strategies are able to target a higher IRR than the larger, more generic pools of infrastructure debt and equity that are most commonly associated with infrastructure investing. Renewable energy debt investments also have an attractive risk profile due to the entry point of investment (after development), the long-term and predictable nature of the projects’ cash flows, and the “closed system” of project financing, which isolates investors from sponsor default and other risks.
In addition to being an attractive standalone infrastructure investment, we also believe renewable energy infrastructure debt can help investors diversify their exposure to middle market direct lending strategies.
For example, the risk profile of middle market direct lending (unlike renewable energy project financing), is tied to the health of corporate borrowers, which means these strategies are heavily correlated to the broader credit cycle.
Among infrastructure investments, we believe renewable energy infrastructure debt strategies are one of the most effective ways to generate attractive risk-adjusted returns.
Since 2001, Voya IM’s aggregate private infrastructure debt production is $13 billion.5 Voya IM launched its renewable energy infrastructure debt strategy in 2019 with over $540 million of committed capital. The team has 20+ years of experience providing flexible capital to capture inefficiencies in renewable energy and sustainable infrastructure project financing. Our team would welcome the opportunity to discuss how renewable energy infrastructure debt fits into your broader strategic asset allocation.
|
Risks of investing The principal risks are generally those attributable to bond investing. Holdings are subject to market, issuer, credit, prepayment, extension and other risks, and their values may fluctuate. In addition, renewable energy infrastructure project financing has the following risks: Resource risk: the risk that the actual amount of sun or wind is less than underwritten. Counterparty (Project/Borrower) risk: the risk that the buyer of electricity (e.g., utility or other project parties) default on payment or otherwise fail to perform. Technology risk: the risk that the equipment (wind turbine or solar panel) fails. Catastrophe risk: the risk that a natural disaster damages the project. |