Senior Loan Talking – April 4, 2024

Mohamed Basma, CFA
Managing Director, Head of Leveraged Credit

Weekly Notables
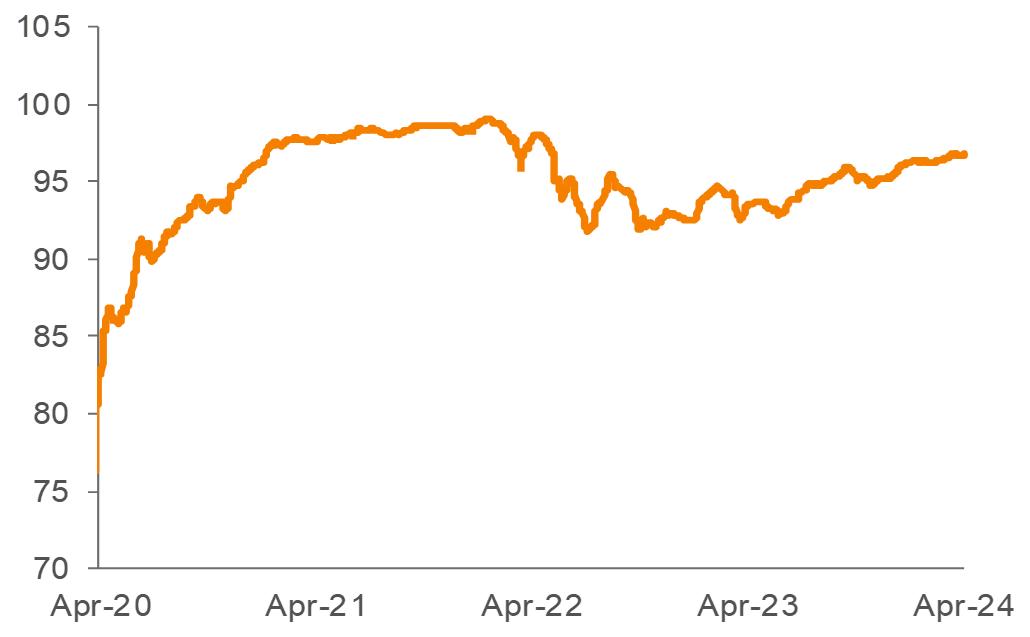
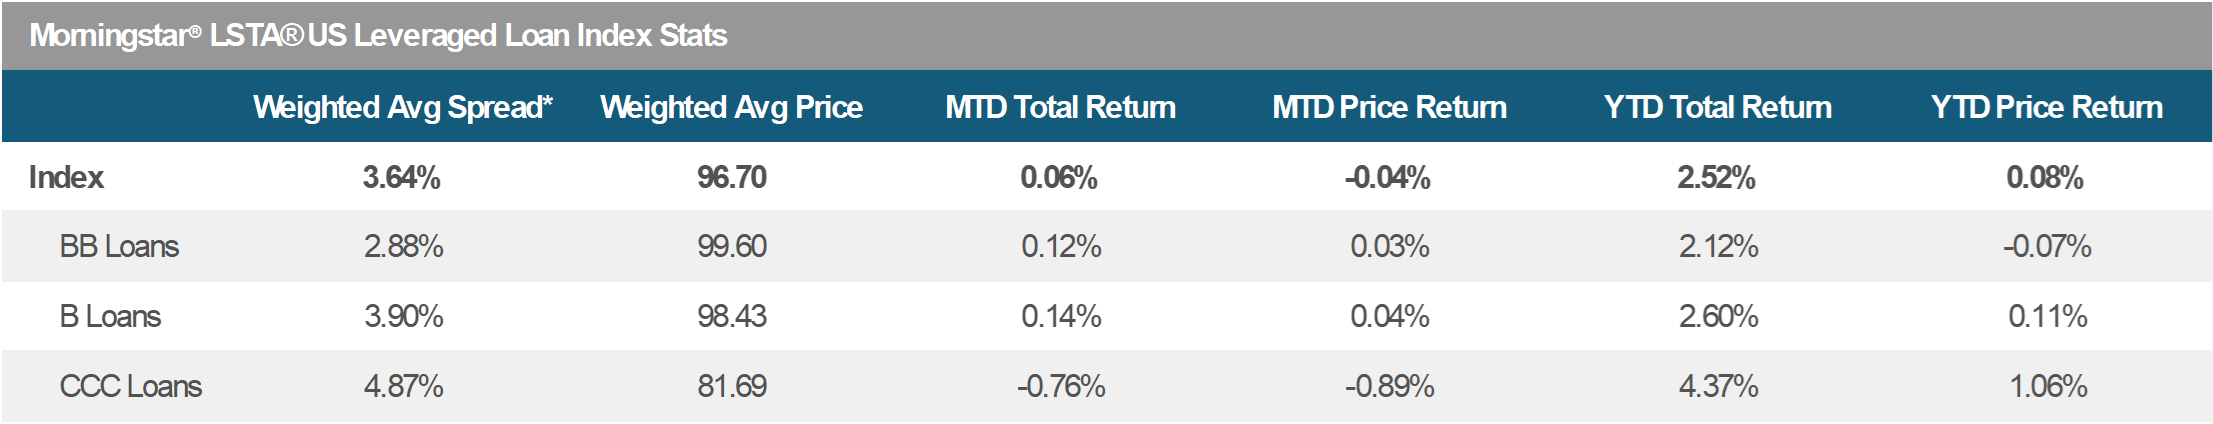
The US loan market posted a gain this week despite some volatility in broader financial markets. The Morningstar® LSTA ® US Leveraged Loan Index (Index) returned 0.14% for the seven-day period ended April 4. The average bid price increased by 1 bp, closing out the week at 96.70.
The main driver of supply in the primary market was refinancing activity; however, LBO-related deals began to gain traction once again. Borrowers are taking advantage of market technicals by repricing their debt. For context, 19% of the outstanding loan market has already been repriced, repaid or extended this year. Looking at the forward calendar, net of the anticipated $11.6 billion of repayments not associated with the forward pipeline, the amount of new supply expected to enter the market is about $5.5 billion, versus $5.3 billion in the prior weekly estimate.
The trading levels in the secondary market remained generally firm. In terms of performance, CCCs are showing signs of decompression, posting a return of -0.66%. In contrast, Single-Bs and Double-Bs gained 0.22% and 0.19%, respectively.
CLO issuance continued at a healthy pace, as managers priced six new deals during the week (including a new deal from Voya), pushing the YTD tally to roughly $50.3 billion. Morningstar reported an inflow of $641 million into retail loan funds for the week ended April 3.
There was one default (ConvergeOne) in the Index during the week.
Source: Pitchbook Data, Inc./LCD, Morningstar ® LSTA ® Leveraged Loan Index. Additional footnotes and disclosures on back page. Past performance is no guarantee of future results. Investors cannot invest directly in the Index. *The Index’s average nominal spread calculation includes the benefit of base rate floors (where applicable).
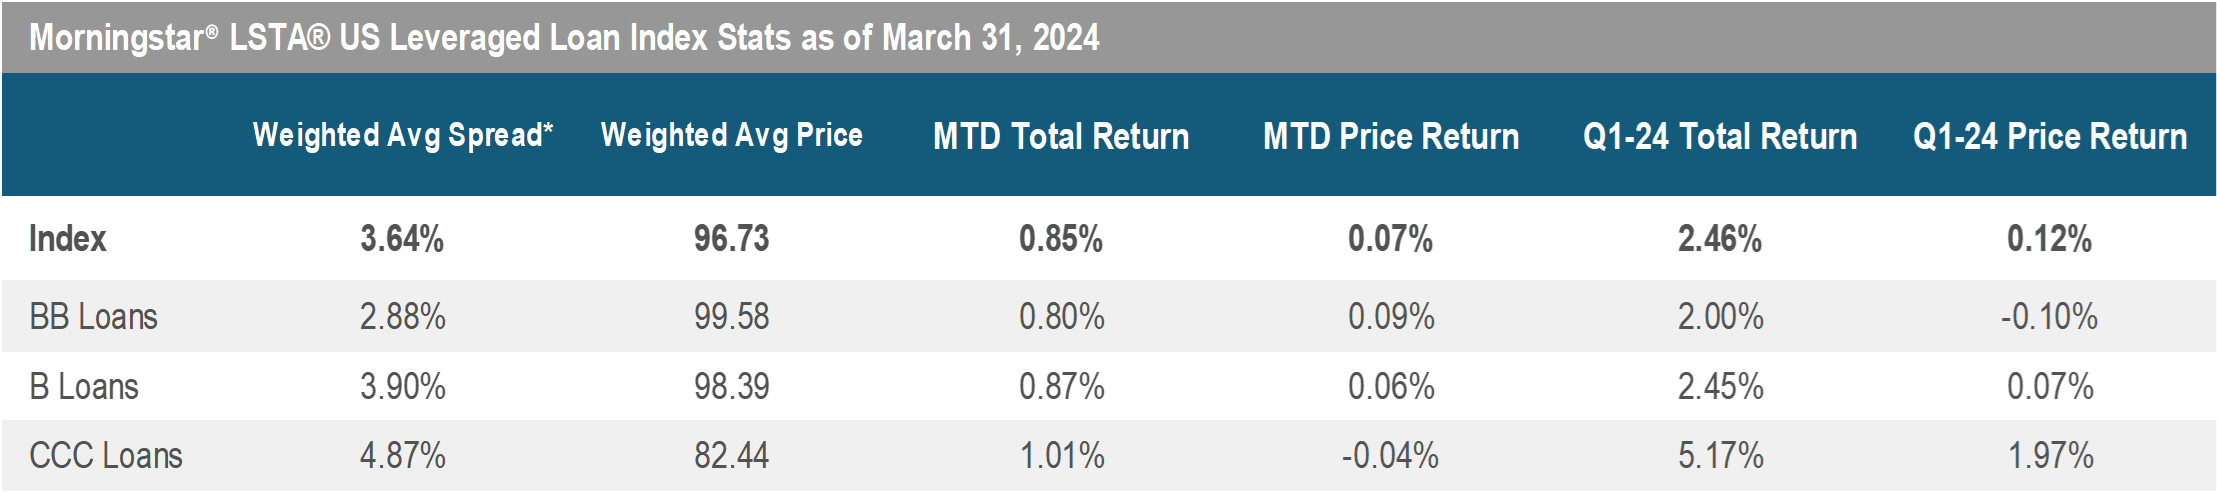
Monthly Recap: March 2024
The loan market underperformed other fixed income asset classes this month, as spread levels for investment grade and high yield bonds continued to reach new cycle lows amidst volatile treasury yields. The loan Index returned 0.85% in March, behind the investment grade and high yield markets, which posted returns of 1.18% (Morningstar US Corporate Bond) and 1.19% (Morningstar US High-Yield Bond TR USD), respectively. The Index average bid price closed out the month at 96.73. Turning to performance in the secondary market, CCC loans were in the lead with a return of 1.01%, followed by Single-Bs and Double-Bs at 0.87% and 0.80%, respectively.
In the primary market, opportunistic deals gained momentum; surpassing February levels as secondary prices rallied. We are now seeing some refinancing transactions for cap structures that were previously financed in the private credit markets, reversing last year’s trend. Loans priced at par and above experienced a notable increase from 21% in February to 39% by the end of March. Total refinancing volume increased to $21 billion from $19.8 billion in February. Meanwhile, repricing activity picked up as well this month, reaching a total of $55 billion (the second highest volume in the past three years). However, the size of the Index declined by $11 billion this month, to $1.39 trillion (reversing the gains in February), as M&A activity remains low.
In terms of demand, CLO issuance moderated to $15.5 billion from $20.7 billion last month. On a YTD basis, CLO volume is currently tracking $48.8 billion across 106 new deals (up 45% from last year's volume), given the liability spread tightening this quarter. In addition, retail loan funds saw the largest monthly inflow since April 2022 at $2.1 billion, bringing YTD net flows to $2.9 billion.
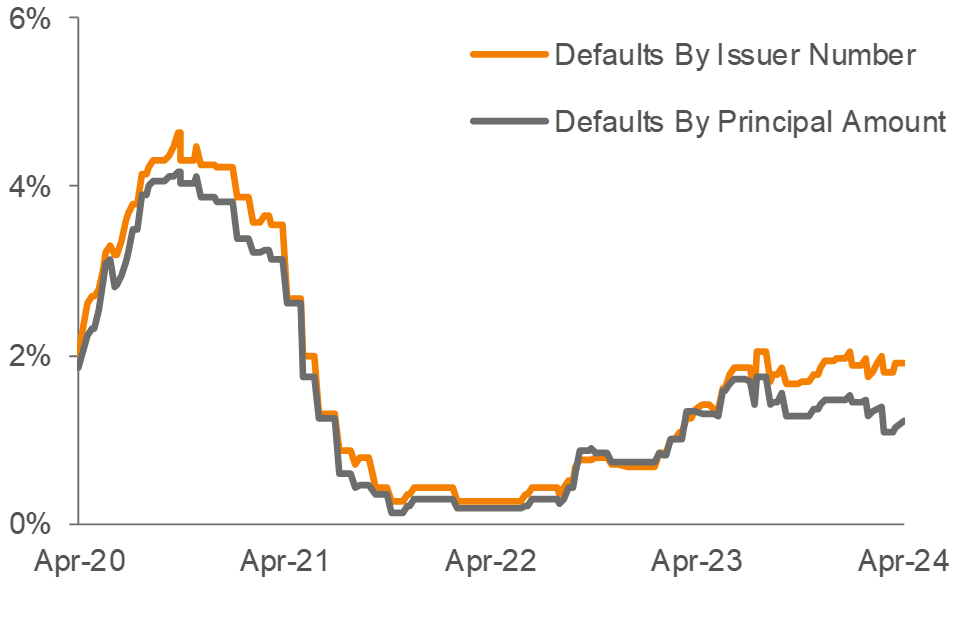
There was one default (Jo-Ann Stores) in the Index during the month. The trailing 12-month default rate by principal amount decreased to 114 bp from 141 bp in February.
Source: Pitchbook Data, Inc./LCD, Morningstar ® LSTA ® Leveraged Loan Index. Additional footnotes and disclosures on back page. Past performance is no guarantee of future results. Investors cannot invest directly in the Index. *The Index’s average nominal spread calculation includes the benefit of base rate floors (where applicable).