Senior Loan Talking Points- May 31 – June 6, 2024

Mohamed Basma, CFA
Managing Director, Head of Leveraged Credit
Weekly Notables
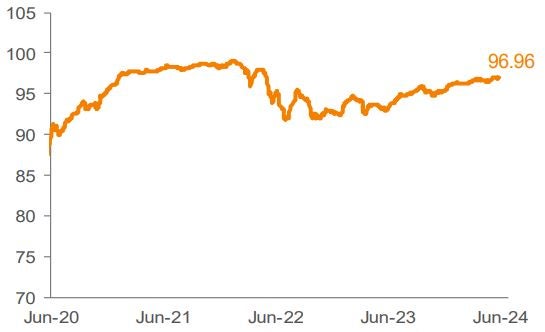
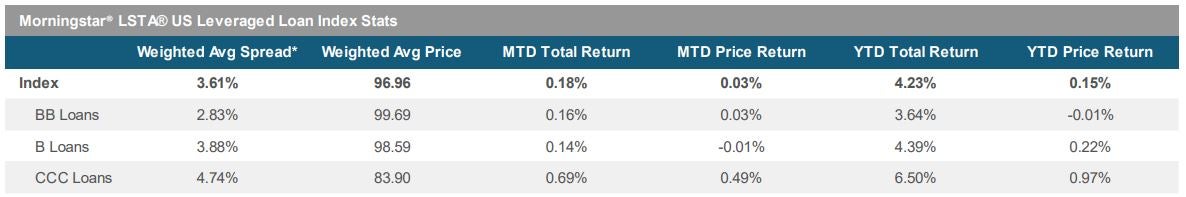
The US loan market, as represented by the Morningstar LSTA US Leveraged Loan Index (Index), gained 0.21% for the seven-day period ended June 6. The average Index bid price increased by three bps, finishing the week at 96.96.
Consistent with the prior month, the primary market remained active in the first week of June, as market participants were busy with an additional 17 repricing transactions. Away from repricing activity, institutional issuance increased to $11.6 billion, driven primarily by refinancings along with a few M&Arelated deals. Looking ahead, net of approximately $16.2 billion of anticipated repayments not associated with the forward calendar, the amount of repayments now outstrips new supply by about $3.1 billion, versus net new supply of $41 million last week.
In the secondary market, investors continued to receive allocations from the deluge of recent deals launched in the primary market, while trading levels remained firm. Performance across rating cohorts was led by the riskiest segments, as BBs, Bs, and CCCs returned 0.17%, 0.17%, and 0.89%, respectively.
Measurable investor demand for the asset class continued at a healthy clip. CLO managers priced four new deals, bringing YTD issuance to $91.7 billion. Retail loan mutual funds and ETFs experienced an aggregate inflow of $582 million for the week ended June 5, according to Morningstar. This brings the latest streak of inflows to seven weeks.
There were no defaults in the Index during the week.
Source: Pitchbook Data, Inc./LCD, Morningstar ® LSTA ® Leveraged Loan Index. Additional footnotes and disclosures on back page. Past performance is no guarantee of future results. Investors cannot invest directly in the Index. *The Index’s average nominal spread calculation includes the benefit of base rate floors (where applicable).
Monthly Recap: May 2024
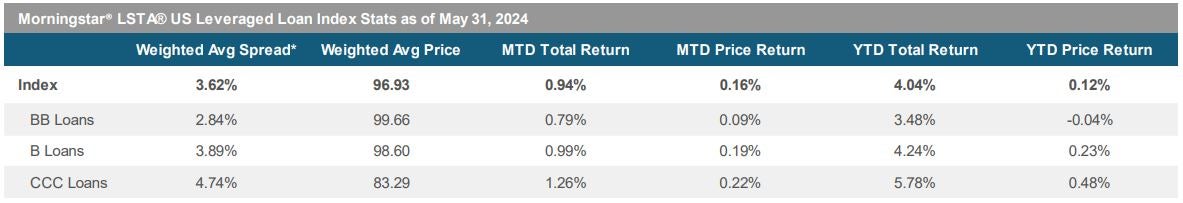
The macro backdrop remained constructive, as a cooler inflation print strengthened the soft-landing narrative. Treasury yields rallied on the news, providing a boost to fixed-rated assets, while loans continued to deliver steady returns. The loan Index advanced by 0.94% in May (highest monthly return of the year), with performance being driven by both interest carry and market value changes, as the average Index bid price closed out the period at 96.93 (up 33 bps from April). By credit ratings, lower-rated names outperformed higher quality. On a YTD basis, returns for the asset class have already clipped the 4% mark through just five months.
The primary market had its busiest month on record, as total deal activity was $180 billion. With over 60% of loans trading above par, another wave of repricings ensued in May. Total monthly repricing volume reached a record of $119 billion, while the YTD volume is currently tracking a record high of $306 billion for the comparable period. Total institutional volume net of repricings increased to $47.4 billion from $34.1 billion in April, as acquisition-related deals began to re-emerge in the market.
On the investor demand side, the market continued to benefit from strong CLO issuance, with another $23.5 billion priced during the month. Tighter CLO liability spreads remain a catalyst behind the material uptick in CLO volume, which continues to be driven by further compression in AAA levels (down about 40 bps YTD and testing the low-140s) on the heels of continued demand from large money-center banks in the US and Japanese investors. In addition, retail loan funds saw an inflow of $3.1 billion (including the monthly reporters) for the month, bringing the YTD tally to $7.4 billion.
Given heavy repayment activity and still relatively low net new issuance, the size of the loan Index, as represented by total outstandings, contracted by $14.3 billion in May, the biggest monthly decrease since August 2019. The size of the Index is now roughly $1,387 billion, the lowest level since early 2022.
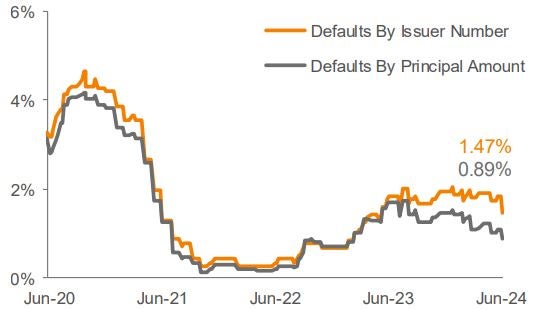
There was one default (Research Now Group Inc) in the Index during the month. The trailing 12-month default rate by principal amount fell to 108 bps in May, from 1.31% in April, as three defaults rolled off from the trailing tally. This marks a 15-month low for the Index's default rate and is 67 bps lower than the recent high-water mark of 1.75% in July 2023.
Source: Pitchbook Data, Inc./LCD, Morningstar ® LSTA ® Leveraged Loan Index. Additional footnotes and disclosures on back page. Past performance is no guarantee of future results. Investors cannot invest directly in the Index. *The Index’s average nominal spread calculation includes the benefit of base rate floors (where applicable).