
Enterprise values of private and public companies are correlated but their movements over time are caused by different factors.
A company’s valuation, otherwise known as its Enterprise Value (EV), takes into account its equity value, its debt and any cash on hand:

For public companies, equity value is also known as a company’s market capitalization, and that value is determined in real time as shares are traded between investors. Given that private companies are not actively traded on exchanges, valuations for these companies are estimated quarterly using various methods, often including valuations of comparable public companies or recent industry transactions of similar companies.
As we consider relative valuation movements between public and private companies, it’s important to understand what was driving any given change in valuation. For example, in the third quarter of 2024, the S&P 500’s1 EV increased 4.4%, primarily due to multiple expansion—which was fueled in part by optimism following the Federal Reserve’s pivot toward interest rate cuts.2 By contrast, the Lincoln Private Market Index (LPMI),3 which tracks the EV of a basket of privately held U.S. companies, increased 2.2%. Unlike in the public market, private equity EV growth was mainly due to strong operational performance (earnings growth).2
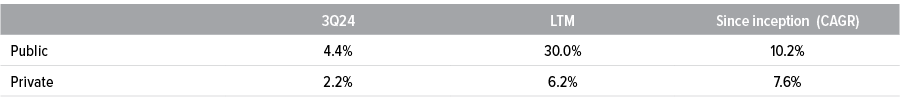
As of 09/30/24. Source: Lincoln Private Market Index. Private companies are represented by the LMPI which measures quarterly changes in the EV of ~1,500 private companies with a median EBITDA of ~$40-45 million. Public companies are represented by the S&P 500 EV index which excludes financial companies for which EV is generally not meaningful; however including such companies produces similar results. See disclosures for index definitions. Since inception data for LPMI is from 1Q14 through 3Q24. Please review footnotes below for more information on the indices used.
Why does it matter?
Private equity returns tend to be less volatile and more closely tied to the underlying operational performance of portfolio companies. Roughly 70% of the time since 2014, operational performance in the form of earnings exceeded multiple expansion.2 We believe this is because private equity firms typically focus on improving a company’s fundamentals through superior management, restructuring and achieving economies of scale, which may lead to sustainable earnings growth over time. While multiple expansion may be beneficial to public equities in the short run—as it has been over the past two years—it relies on improving market conditions and investor sentiment around a number of macro inputs, which can be unpredictable and are often out of the asset owner’s control. And returns based on multiple expansion often reverse course more quickly than operational performance in down cycles.

As of 06/30/24. Private source: Lincoln Private Market Index, Lincoln International LLC.; PitchBook report, “U.S. PE Breakdown Report (2Q24).” Latest available. Public source: Capital IQ. EBITDA is earnings before interest, taxes, depreciation and amortization. Multiples are shown for the preceding 12-month period.
Lower valuation multiples of private companies relative to their public counterparts may present attractive entry points in the near term, especially as the M&A market continues to open up. Furthermore, private investments are carried at unrealized valuations, which are typically based on longer-term averages of public comparables, as well as a thorough assessment of a company’s financials and operational performance. When private equity companies are sold, it often happens at an increase in valuation as full market value is frequently higher than a more backwards-looking or discounted unrealized valuation policy by the asset owner. This gap between realized and carried valuation can offer significant upside return potential, as it isn’t typically factored into base case return forecasts.
Bottom line:Private equity interim performance is often tied more to operational performance than multiple expansion, which may help mitigate volatility and lead to upside surprises, as companies are often sold at increased valuation multiples reflecting full market value. |
A note about risk
General risks to consider
Secondary investments: The ability of the manager to select and manage successful investment opportunities, underlying fund risks; these are non-controlling investments, no established market for secondaries, identify sufficient investment opportunities, and general economic conditions.
Primary investment: Identify sufficient investment opportunities, blind pool, the manager’s ability to select and manage successful investment opportunities, the ability of a private equity fund to liquidate its investments, diversification, and general economic conditions.
Venture Capital: Characterized by a higher risk and a small number of outsize successes, has the most volatile risk/reward profile of the private equity asset class.
Growth Equity: These companies typically maintain positive cash flow and therefore present a more stable risk/ reward profile.
Mezzanine Financing: Has the most repayment risk if the borrower files for bankruptcy and in return, mezzanine debt generally pays a higher interest rate.
Leveraged Buyout: Generally exited through an initial IPO, a sales to a strategic rival or another private equity fund, or through a debt-financing special dividend, called a dividend recapitalization.
Distressed Buyout: Offer the opportunity to invest in debt securities that trade at discounted or distressed levels with the potential for higher future value if the company recovers.
General private equity risks
Private equity investments are subject to various risks. These risks are generally related to: (i) the ability of the manager to select and manage successful investment opportunities; (ii) the quality of the management of each company in which a private equity fund invests; (iii) the ability of a private equity fund to liquidate its investments; and (iv) general economic conditions. Private equity funds that focus on buyouts have generally been dependent on the availability of debt or equity financing to fund the acquisitions of their investments. Depending on market conditions, however, the availability of such financing may be reduced dramatically, limiting the ability of such private equity funds to obtain the required financing or reducing their expected rate of return. Securities or private equity funds, as well as the portfolio companies these funds invest in, tend to be more illiquid, and highly speculative.