Beyond the Mega Caps: 3 Reasons to Seek Growth in Small Caps

Client Portfolio Manager, Small Cap Growth

With mega cap stocks dominating large cap indexes, investors face a dilemma: Either accept the risks of a highly concentrated and crowded market, or look elsewhere for growth. Our solution? Diversify into small cap names that offer high growth potential at discounted valuations, with compelling near-term catalysts.
Three reasons to consider small caps
1. Small caps provide diversification, lower concentration risk
While the U.S. large cap growth universe includes hundreds of companies, a handful of mega cap tech and communication services firms have been the primary drivers of performance. One measure of concentration—the inverse of the Herfindahl‑Hirschman Index (1/HHI) which shows the effective number of stocks powering returns—suggests the Russell 1000 Growth Index is basically behaving like a portfolio of only about 17 stocks (Exhibit 1).
In contrast, small cap growth stocks offer much broader diversification. The Russell 2000 Growth Index reflects the performance of roughly 357 stocks, spreading return drivers across a wider base. This breadth reduces single‑name risk and can make portfolios more resilient when leadership rotates.
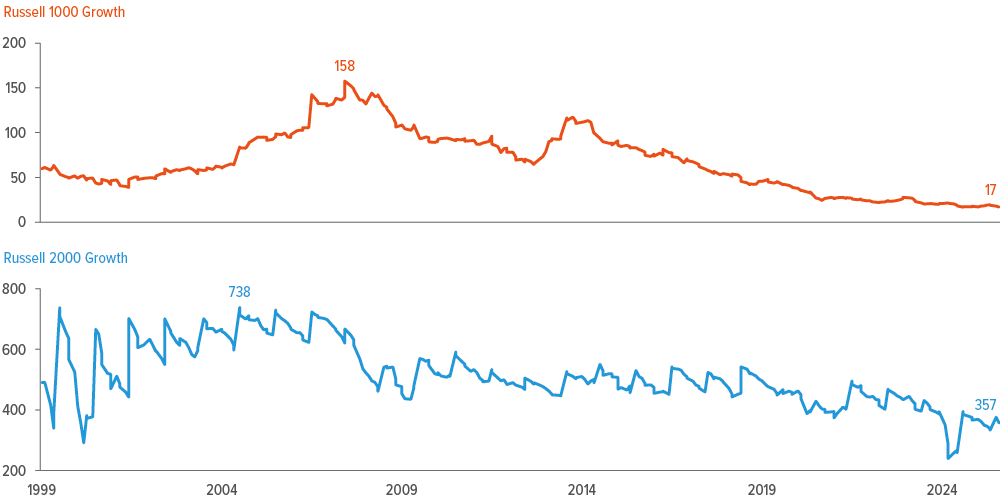
As of 07/31/25. Source: FactSet, Voya IM. Effective number of stocks is measured by the inverse of the Herffindahl-Hirshman Index (HHI), which is a proxy for index concentration.
2. Small caps deliver higher growth at lower valuations
Investors have accepted large cap concentration risk in pursuit of growth. However, small caps have consistently offered higher and more stable earnings growth than large caps over the past 25+ years (Exhibit 2, left side). Sales growth has also been robust, with mega caps helping to narrow the gap only recently. (Mega-caps’ outperformance over the rest of the large cap segment is evident in the recent divergence of the blue and gray lines in Exhibit 2, right side.)
Importantly, small caps deliver this growth at lower valuations. They have historically traded at an average 8% discount to large caps—a justifiable valuation, given their volatility and vulnerability to exogenous factors. But today, the valuation gap has widened to 36%.1
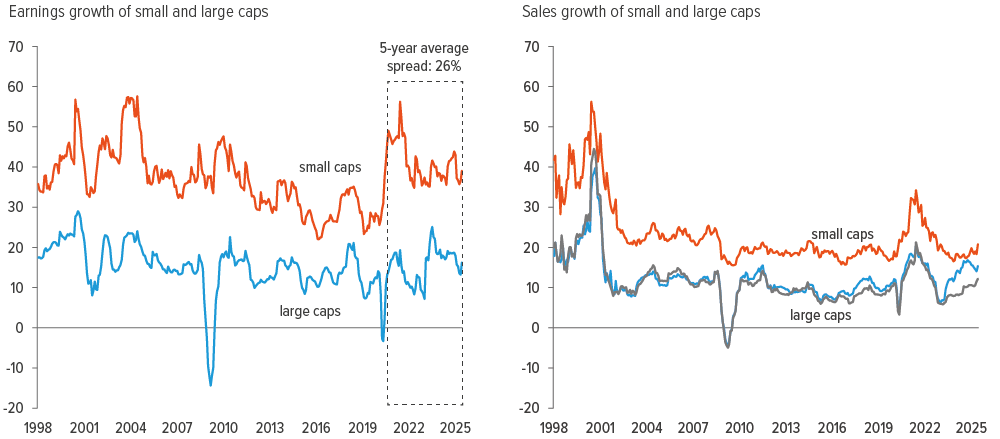
As of 06/30/25. Source: Voya IM. Data show the earnings growth of the indexes from 01/98 through 06/25. Small cap stocks represented by the Russell 2000 Growth Index. All unprofitable firms were stripped out of the Russell 2000 Growth Index. Large cap stocks represented by the Russell 1000 Growth Index. The gray line shows the Russell 1000 Growth Index minus the 10 largest cap companies.
3. Near-term catalysts could unlock small cap upside
Smaller companies have been disproportionately affected by the trade uncertainty and persistently high interest rates. However, as uncertainty abates and rates fall, we expect small caps to rebound. Evidence of outperformance emerged in August as expectations for rate cuts increased.
While both large and small companies benefit from lower interest rates, small caps stand to gain more because they rely heavily on short-term loans and floating-rate debt. As rates decline, these companies can refinance at lower costs, boosting earnings and freeing up capital for growth.
With the Federal Reserve expected to cut rates four times by July 2026,2 historical trends point to a favorable environment for small caps (Exhibit 3). After the first-cut in each of the last eight cycles since 1989, small caps delivered a 3-year annualized average return of 9.9% (outperforming large caps, which averaged 8.8%).3
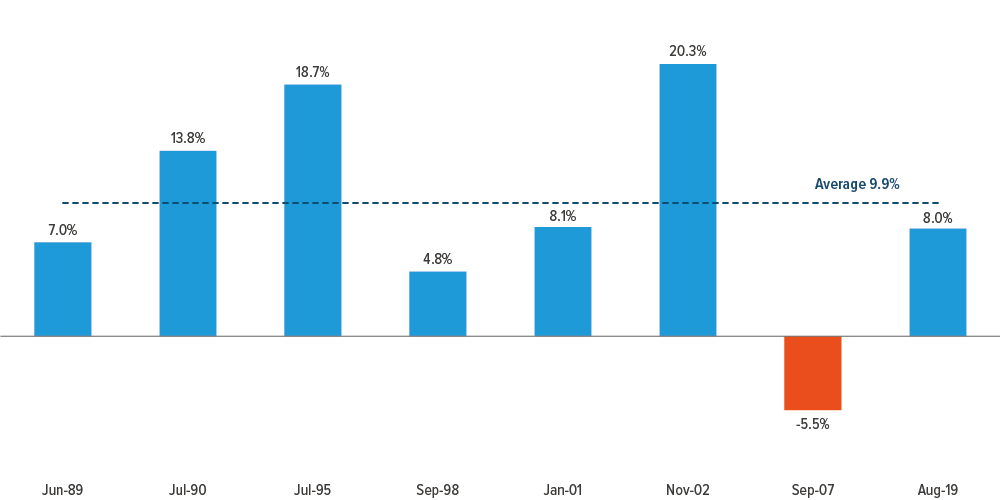
As of 09/23/24. Source: FactSet. Data show 3-year annualized returns (%) of Russell 2000 Total Return Index after first rate cut in a given cycle. Past performance does not guarantee future results.
Active management can capitalize on inefficiencies
The small cap universe is big and the market is inefficient. Over the last 25 years, half of the companies in the Russell 2000 Growth Index (small caps) were unprofitable.4 Smaller firms typically have less financial flexibility, so the gap between the best growers and persistent loss‑makers can be wide.
This dispersion creates opportunities for active managers. Over the past decade, actively managed U.S. small cap growth funds have, on average, outperformed passive peers by ~50 bp per year.5 We believe fundamental research, balance‑sheet discipline, and valuation awareness are key to identifying sustainable businesses with strong growth potential—helping investors avoid overreliance on a concentrated group of mega cap names.
A note about risk: The principal risks are generally those attributable to investing in stocks and related derivative instruments. Holdings are subject to market, issuer and other risks, and their values may fluctuate. Market risk is the risk that securities or other instruments may decline in value due to factors affecting the securities markets or particular industries. Issuer risk is the risk that the value of a security or instrument may decline for reasons specific to the issuer, such as changes in its financial condition. More particularly, the strategy invests in smaller companies which may be more susceptible to price swings than larger companies because they have fewer resources and more limited products, and many are dependent on a few key managers.