
Mohamed Basma, CFA
Managing Director, Head of Leveraged Credit
Weekly Notables
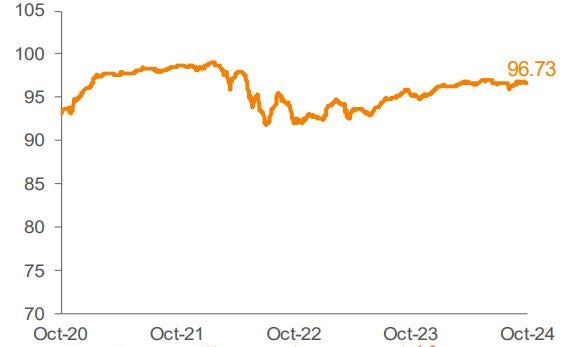
The US loan market’s performance moved higher this week. For the seven-day period ended October 3, the Morningstar® LSTA® US Leveraged Loan Index (Index) returned 0.21%. The average Index bid price gained 5 bp, finishing the week at 96.73.
September’s strong issuance carried over into the first few days of October, as total volume during that period was about $2.4 billion. Turning to the forward calendar, net of the anticipated $12.1 billion of repayments not associated with the forward pipeline, the amount of new supply projected to enter the market is about $5.3 billion, down from last week’s supply of $10.3 billion.
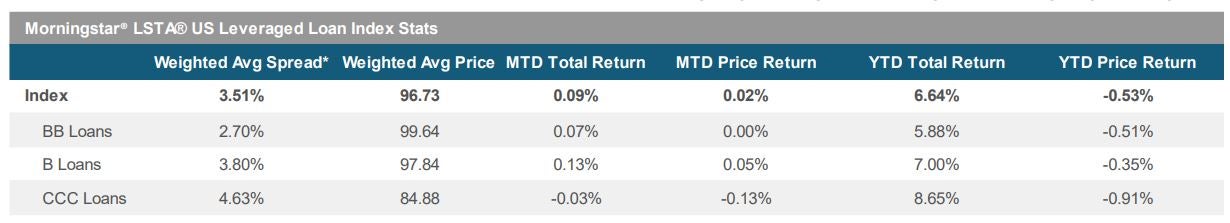
Activity in the secondary market was muted this week. Looking at performance, lower-rated names continued to outperform higher-rated credits. For the week, Double-Bs, Single-Bs and CCCs returned 0.15%, 0.23% and 0.40%, respectively.
There was a surge in CLO issuance, as CLO managers priced 15 new deals during the week. YTD volume is currently over $144 billion. According to Morningstar, loan retail funds recorded an inflow of $37 million for the week ended October 2. The funds experienced only three weekly inflows totaling $96 million over the last 10 weeks.
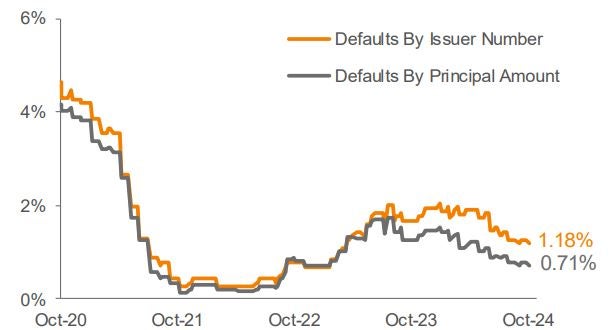
There were no defaults in the Index during the week.
Source: Pitchbook Data, Inc./LCD, Morningstar ® LSTA ® Leveraged Loan Index. Additional footnotes and disclosures on back page. Past performance is no guarantee of future results. Investors cannot invest directly in the Index. *The Index’s average nominal spread calculation includes the benefit of base rate floors (where applicable).
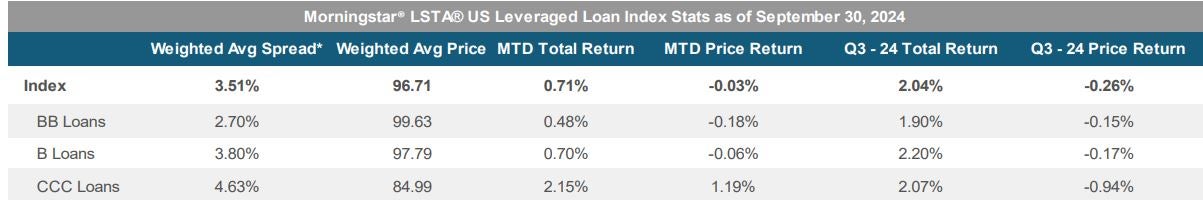
Monthly Recap: September 2024
Risk assets performed well in September, despite all the noise around economic data, monetary policy, and geopolitical escalations. The loan market was steady, as the Index returned 0.71% this month. However, loans underperformed the other risk asset classes and treasuries, as investment grade, high yield bonds and the US 10-year treasury posted gains of 1.76% (Morningstar US Corporate Bond Index), 1.63% (Morningstar US High-Yield Bond TR USD) and 1.37% (S&P 10-year Treasury Index), respectively.
The average Index bid price lost 4 bp, closing out the month at 96.71. Looking at ratings, there was a notable dispersion among rating cohorts. Bid prices moved higher for CCCs, but softened for BBs and Bs. In terms of returns, Double-Bs, Single-Bs and CCCs returned 0.48%, 0.70% and 2.15%, respectively. On a YTD basis, returns have been relatively uniform across ratings segments, although lower-rated categories continued to outperform given the stable macro backdrop.
On the issuance side, volume increased compared to the previous months, driven by a significant pick-up in supply of LBOs, M&A and dividend recaps entering the market. Total institutional volume was roughly $69.4 billion this month (the highest monthly volume in 2024). Acquisitions and dividend recapitalizations were the main drivers of issuance in September, as $48 billion of total issuance were not tied to refinancing activity (highest reading since January 2022). For context, the average volume excluding opportunistic deals was about $18 billion in the last 12 months. Turning to repricing and refinancing activity, this month’s volume was behind 1H24 pace, totaling $50.5 billion and $21.5 billion, respectively. Despite the slowdown, opportunistic deals are still running at a record pace on a YTD basis.
On the other hand, demand for loans moderated in September. CLO issuance decreased this month to $11.9 Billion across 25 deals, but YTD pace remains record breaking. YTD volume currently stands at $142 billion, up 69% from last year's issuance of $84 billion. On the other hand, retail loan funds saw some outflows, as investors withdrew $1.1 billion from funds, but have experienced net inflows of $3.1 billion for the YTD period.
There was one default (Wheel Pros) in the Index during the month. The trailing 12-month default rate by principal amount slightly increased to 0.80%. We expect only a gradual increase in defaults over the medium term. However, the market has experienced some distressed exchanges and LMEs which continue to be very topical across a handful of acute credit situations.
Source: Pitchbook Data, Inc./LCD, Morningstar ® LSTA ® Leveraged Loan Index. Additional footnotes and disclosures on back page. Past performance is no guarantee of future results. Investors cannot invest directly in the Index. *The Index’s average nominal spread calculation includes the benefit of base rate floors (where applicable).