Senior Loan Talking Points – April 3, 2025

Mohamed Basma, CFA
Managing Director, Head of Leveraged Credit

Weekly Notables
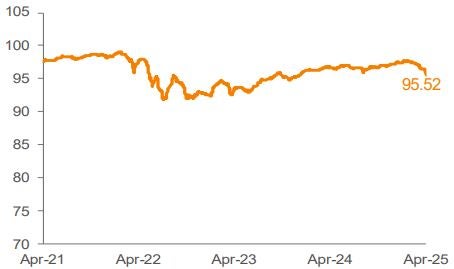
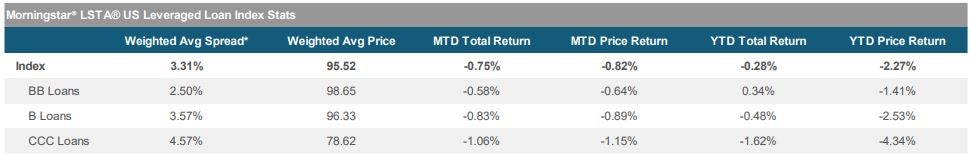
Volatility picked up sharply this week, as Trump’s hawkish reciprocal tariff announcements caught markets by surprise. Given the increased risk of higher inflation and slower growth, risk sentiment soured with equities posting their worst day since 2020 and credit spreads moving notably wider. The loan market posted a return of -0.93%, marking the worst weekly performance of the year. The average Index bid price lost 100 bp, closing out the week at 95.52. Despite the weakness in bid prices, trading remained relatively orderly and two-way driven. As headline noise remains elevated with limited visibility on the full potential impacts on the economy due to the various moving pieces, we expect the loan market to be correlated with broader financial markets in the near term until more clarity forms.
Market volatility has suppressed new issue activity in the primary market ahead of the tariff announcement, with the outcome of the meeting further exacerbating the already muted supply volumes. In the forward calendar, net of the anticipated $16 billion of repayments not associated with the forward pipeline, the amount of new supply projected to enter the market was $2.2 billion, down from $14.6 billion in the prior weekly estimate.
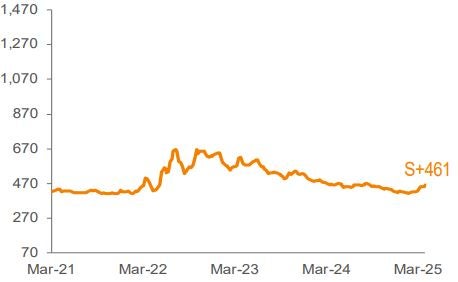
Trading levels in the secondary market declined across all rating cohorts this week. Investors’ confidence has weakened, leading to a decrease in their risk appetite. In terms of performance, DoubleBs, Single-Bs and CCCs returned -0.67%, -1.02%, -1.62%, respectively.
CLO issuance moderated this week, with only three deals priced during the week. YTD total volume is about $49.1 billion. On the retail side, investors have continued to withdraw assets from funds for the fifth week in a row. For the week, outflows totaled around $230 million, with all of the outflows coming from ETFs, while mutual funds added $68 million.
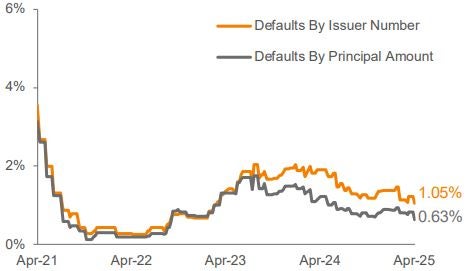
There were no defaults in the Index this week.
Source: Pitchbook Data, Inc./LCD, Morningstar ® LSTA ® Leveraged Loan Index. Additional footnotes and disclosures on back page. Past performance is no guarantee of future results. Investors cannot invest directly in the Index. *The Index’s average nominal spread calculation includes the benefit of base rate floors (where applicable).
Monthly Recap: March 2025
Similar to other spread products, the backdrop weakened in March due to growth and tariff concerns. The loan market returned -0.31% in March, marking the first month of negative performance since October 2023. Despite the losses, loans outperformed both equities and other credit products such as high yield and investment grade. However, loans returned 0.48% in Q1, which was one of the worst first quarters in the last 25 years.
Turning to the secondary market, trading levels declined this month, as the average bid price lost 84 bp, closing out the month at 96.31. The share of loans priced at par or higher decreased to 10.3%, versus 36% last month. By credit quality, BBs outperformed by a decent amount, as risk appetite softened. BBs, Bs and CCCs returned 0.09%, -0.41%, and -1.84%, respectively.
New institutional issuance was low this month, with M&A and refinancing transactions being the primary drivers of issuance. Repricings have understandably slowed given the recent decline in secondary trading levels. Total repricing volume fell to $8.7 billion from $40 billion in February. For the quarter, repricings were about $199.2 billion, surpassing the $159 billion recorded during the comparable period in 2024. Away from repricing, total supply fell to $35.9 billion this month from $44.2 billion in February and $64.4 in January. In Q1, total institutional volume was slightly higher than Q1 2024.
Looking at the demand side, CLO formation remained strong, but on the retail side, there were significant outflows due to ongoing macro uncertainty and market volatility. CLO issuance was about $18.8 billion, down from $19.9 billion in February. For the quarter, 97 deals were priced during that period, totaling $48.6 billion, in line with Q1 2024 volume of $48.8 billion. On the retail side, $6.2 billion exited the loan funds, compared to an inflow of $2.1 billion last month. The total YTD net inflow stands at $1.7 billion. Of this total, approximately 26% of the flows came from ETFs, while mutual funds accounted for the remaining 73%.
There were two defaults in the Index during the month. The trailing 12-month default rate by principal amount increased by 1bp to 0.82%. Default activity continues to skew towards distressed exchanges and LMEs, as the loan default rate inclusive of LMEs closed out March at 4.31%, up from 4.18% in February.
