



Key Takeaways
Feeling uneasy during a market decline is normal, but making a quick decision to relieve that discomfort can affect long-term results.
Most corrections have stopped short of becoming bear markets, and markets have historically recovered from both.
Timing the market during volatility requires two perfect decisions: when to sell and when to buy in again. Most investors get at least one wrong. If you’re considering a change, talk with your advisor first.
Market declines can be unsettling, but not every uncomfortable moment calls for action.
You checked your account. The number was lower than last time. Or maybe a headline or something on your newsfeed caught your eye—"markets in correction territory"—and now you’re wondering if you should do something.
It’s hard to watch the market fall and sit still. When your savings are involved, taking action can feel more responsible than doing nothing. But a decision made to ease today’s anxiety can come at the expense of tomorrow’s goals.
Here's what's actually going on, and why the instinct to act fast is usually something to resist.
First, put the decline in context
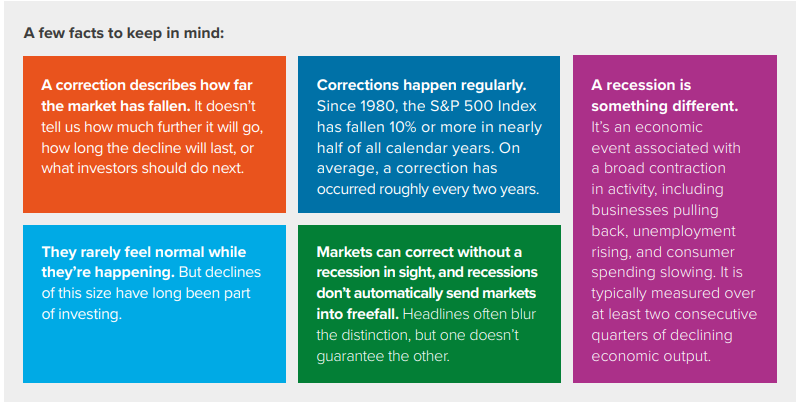
A market correction has a specific definition: a decline of 10% or more from its most recent high. When people say the market has entered correction territory, they generally mean the S&P 500 Index, which tracks 500 of the largest U.S. companies, has crossed that threshold.
Most corrections don’t become bear markets
A correction can feel like the beginning of something much worse. Most of the time, it hasn’t been.
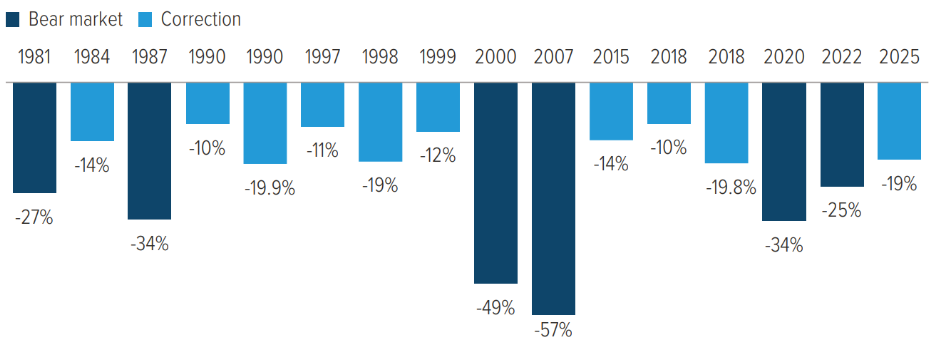
Since 1981, the S&P 500 has experienced 16 corrections of 10% or more. Only 6 became bear markets, defined as declines of 20% or more.
The market has absorbed oil crises, wars, interest-rate shocks, a global financial crisis, and a pandemic that shut down much of the economy in a matter of weeks. Each time, investors had reasons to believe the damage might last. It didn’t.
As of 08/31/26. Source: Bloomberg, Voya IM.
Recoveries often begin before the outlook improves
For declines that remained corrections, recovery has historically been measured in months.
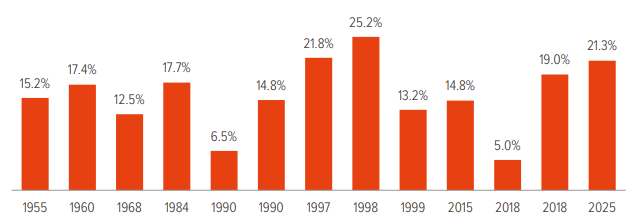
For 10%+ declines that remained corrections, recovery from the trough to the prior high averaged about three months. Looking at 13 corrections since 1955, the S&P 500 Index went on to deliver an average price return of 15.6% during the 12 months after entering correction territory. All 13 subsequent 12-month periods were positive.
As of 08/31/26. Source: Bloomberg, Voya IM.
Even larger declines have eventually reversed course. The 2000 dot-com crash, the 2008 global financial crisis, and the sharp pandemic selloff of 2020 all felt overwhelming in real time. Yet markets recovered.
Selling may bring relief, but it creates another decision
Moving to cash can feel safer when markets are falling. Your account stops moving with the market, and you no longer have to wonder how much further stocks might decline.
But that relief comes with a new problem: deciding when to invest again. Getting out is one decision; getting back in is another. Investors who sell during a decline may wait for the outlook to improve before returning, but the market rarely provides an all-clear signal.
The catch is that rebounds often begin before investors expect them to. Eight of the 10 best S&P 500 days happened while the index was already down 20% or more from its prior high.1 By the time it feels safe to invest again, a significant part of the recovery may already have passed. The result is a familiar pattern: selling after prices have fallen, then buying back after they’ve risen. That works against the basic goal of buying low and selling high.
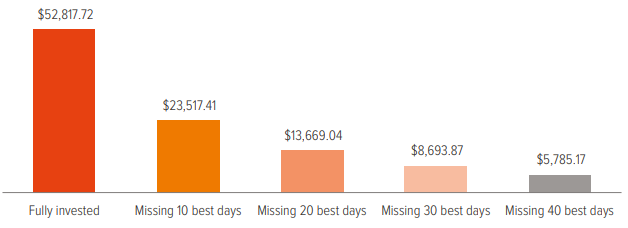
For example, from January 1, 2000, through August 31, 2026, a $10,000 investment in the S&P 500 Index would have grown to about $52,817, based on price returns. Missing just the 10 best days would have changed the outcome dramatically. An investor who was out of the market on those days would have ended with about $23,517 instead. That’s roughly $29,000 less, or a 55% lower ending value, from missing only 10 days across more than 6,700 trading days.
As of 08/31/26. Source: Bloomberg, Voya IM.
What you can do now
A correction can be a good time to review your plan. Start with what, if anything, has changed in your own life. Consider:
- When will you need this money?
- Does your mix of stocks, bonds, and other investments still fit your goals?
- Has your financial situation or tolerance for market declines changed?
- Are you reacting to a change in your circumstances, or to a change in the headlines?
If your goals, time horizon, and circumstances haven’t changed, a market decline alone may not call for a change in your portfolio.
Your advisor isn’t there to predict what the market will do next. No one can do that consistently. Their job is to help you determine whether your portfolio still fits your needs and whether any change you’re considering supports your long-term plan.
If recent market moves have you questioning that plan, call your advisor before making any changes. The conversation can help separate a change in your life from a difficult stretch in the market.
A note about risk: The principal risks are generally those attributable to stock investing. Holdings are subject to market, issuer and other risks, and their values may fluctuate. Market risk is the risk that securities may decline in value due to factors affecting the securities markets or particular industries. Issuer risk is the risk that the value of a security may decline for reasons specific to the issuer, such as changes in its financial condition. All investing involves risks of fluctuating prices and the uncertainties of rates of return and yield inherent in investing.