Sizing Up Small Caps: Three Metrics That Stand Out

Client Portfolio Manager, Small Cap Growth

Three numbers tell the small cap story right now: Earnings, valuations, and rates. It’s a setup that deserves attention.
Small cap stocks have rallied nearly 50% since Liberation Day.1 While that move raises questions about what’s left, these three metrics suggest the opportunity may still be unfolding.
1
A steeper earnings growth path
Think of small caps as a younger sibling in the family—still growing, sometimes unevenly, but with far more runway ahead. While recent years have favored large caps, the outlook appears to be shifting. Over the next two years, small caps are expected to enter a meaningful growth phase (Exhibit 1), setting the stage for a potential earnings “growth spurt” that could drive attractive upside.
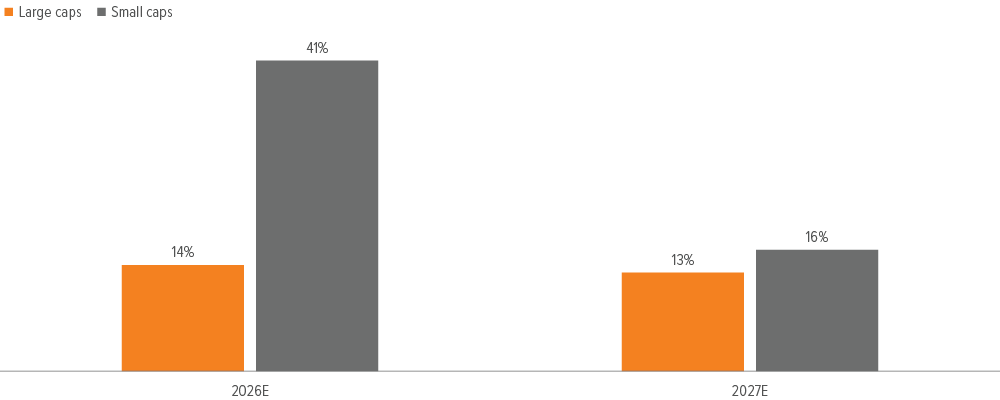
As of 12/31/25. Source: FactSet, Voya IM. Large caps represented by the Russell 1000 Index. Small caps represented by the Russell 2000 Index.
2
A wide valuation discount
Investors typically expect a return premium when investing in smaller companies. That’s natural—smaller firms often operate with fewer financial levers and more constraints. Historically, that dynamic has led small caps to trade at an 8% discount to large caps.
Today, the discount is far deeper at 36%, four and a half times the average (Exhibit 2). Valuation gaps of this size have historically moved closer to long‑term averages over time.
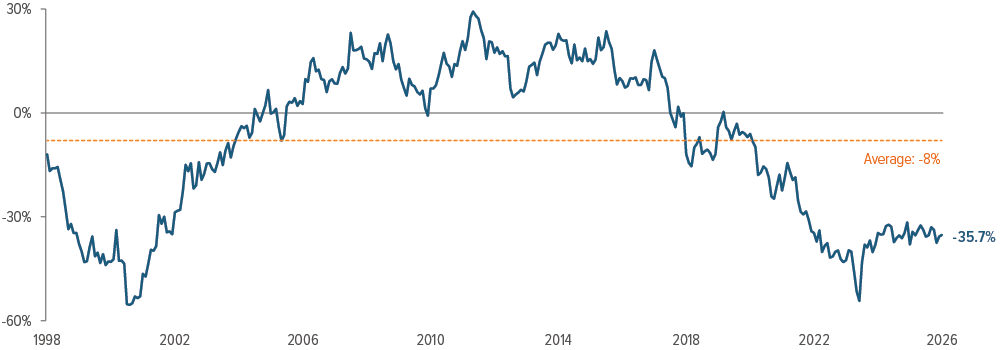
As of 12/31/25. Source: FactSet, Voya IM.
3
More benefit from falling interest rates
Most small cap companies rely heavily on short term and variable rate borrowing, ranging from term loans to credit lines to equipment financing (Exhibit 3). This structure makes them more sensitive to interest rate changes—but it also means they benefit disproportionately when rates decline.
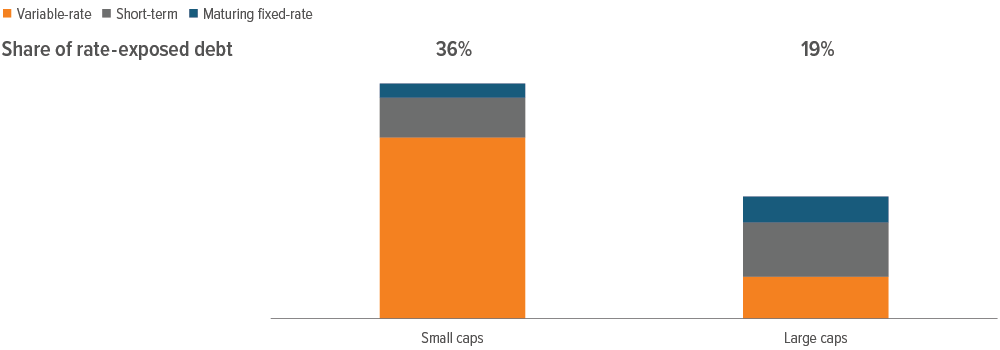
As of 12/31/25. Source: Empirical Research Partners. Data show the share of debt exposed to interest rates for large caps, represented by Empirical’s proprietary universe of the largest 750 names and small caps, represented by Empirical’s proprietary universe of the next 2000 names.
Last year, the Federal Reserve cut rates three times (totaling 75 bps). This year, forecasts point to an additional 60 bp of easing.2 For companies carrying mostly floating rate debt, those reductions flow directly into lower borrowing costs and better earnings power—a meaningful advantage at a time when rate trends are moving in their favor.
The bottom line
Small caps have already seen support from AI related enthusiasm, easing tariff concerns, a strong labor market, and rate cuts. Looking ahead, their earnings outlook, deep valuation discount, and added benefit from further rate reductions form a compelling case for smaller companies to have steady representation in portfolios going forward.
A note about risk: The principal risks are generally those attributable to investing in stocks and related derivative instruments. Holdings are subject to market, issuer and other risks, and their values may fluctuate. Market risk is the risk that securities or other instruments may decline in value due to factors affecting the securities markets or particular industries. Issuer risk is the risk that the value of a security or instrument may decline for reasons specific to the issuer, such as changes in its financial condition. More particularly, the strategy invests in smaller companies which may be more susceptible to price swings than larger companies because they have fewer resources and more limited products, and many are dependent on a few key managers.