Fixed Income Perspectives: Three Buffers Against Today’s Shocks

Head of Multi-Sector Fixed Income

Markets are being tested on several fronts at once. But the important question is how these shocks travel—through inflation, monetary policy, funding conditions, or issuer fundamentals. That’s where resilience begins to diverge.
Same shock, different transmission
Major news events tend to hit markets in two stages. First comes the reaction (“sell first, ask questions later”). Then comes the sorting. Spreads often widen before fundamentals worsen because markets reprice uncertainty, liquidity, and adjacent exposures. What matters is not simply whether volatility rises, but where pressure is likely to persist.
In today’s environment, three structural buffers help explain why the impact of current shocks has been uneven across markets and geographies.
Buffer #1: The U.S. is better insulated from an oil shock than in prior cycles
In prior energy shocks, the U.S. economy was more directly exposed. Higher oil prices fed inflation, the Federal Reserve tightened, credit conditions worsened, and growth slowed. That transmission channel still exists, but it’s weaker than it once was.
The United States has been a net energy exporter since 2019 and it set a record for crude oil production in 2025.3 Although the Strait of Hormuz remains critical to global energy markets, the U.S. imported only about 0.5 million barrels per day of crude oil and condensate from Persian Gulf countries through the Strait in 2024, about 2% of U.S. petroleum liquids consumption. Meanwhile, roughly one-fifth of global oil supply still moves through Hormuz, which is why the global price shock remains real even if the direct U.S. exposure is lower.
Why is this important? The old playbook looks less automatic this time, with lower dependence on Gulf oil muting some of the classic transmission into domestic growth and inflation.
Buffer #2: Central bank optionality matters as much as the shock itself
The second question is whether policymakers make conditions worse. The Fed held rates steady in March and said the implications of Middle East developments for the U.S. economy remain uncertain. That, plus disinflationary forces heading into the war, give the Fed room to wait. But not unlimited room. Inflation was sticky before the latest oil move, with headline PCE up 2.8% from the prior year in February, and core PCE up 3.0%.4 In March, CPI accelerated to 3.3%, with energy up 10.9% overall and gasoline up 21.2%.5 Recent Fed commentary has also leaned cautious, with officials warning that higher energy prices could keep inflation elevated and rates on hold for longer.
For fixed income, the issue is not just the shock itself, but whether policy turns it into something larger. If the oil spike proves temporary and inflation expectations stay anchored, the Fed can afford to wait. If higher energy costs start feeding more visibly into core inflation and expectations, that flexibility narrows.
Buffer #3: Private-credit stress looks meaningful, but still selective—and gradual
With private credit, the issue is concentrated stress rather than broad systemic failure. Recent pressure has been most visible in areas heavily exposed to software and services, where AI disruptions are challenging business models and valuations and tightening lending conditions.
Current evidence suggests that selective repricing is more likely than a crisis resembling 2008. Notably, these loans are not heavily concentrated on traditional bank balance sheets, which reduces systemic risk, and the potential for rapid deleveraging throughout the banking sector. Instead, they are distributed among various holders and structures, such as non-bank lenders, private funds, and insurance companies.
That doesn’t mean public markets are fully insulated. Stress in private credit can still widen spreads in adjacent sectors and tighten financing conditions. But we believe the stress is likely to unfold over several quarters, expressed through greater dispersion.
Where resilience actually comes from
Broad market calm can hide sharp differences beneath the surface. In this kind of environment, resilience is less about being broadly defensive and more about selectively owning securities backed by cash flows that can absorb higher input costs, tighter funding conditions, increasing technology disruption, and episodes of spread volatility.
In our view, this is the kind of market where bottom-up research, issuer-level analysis, and careful sector selection can add even greater value. When shocks travel unevenly, resilience becomes more security-specific, and active management becomes more important for separating income opportunities from avoidable risk.
Sector outlooks


- Spreads widened due to heavy new-issue supply and increased rate volatility, with geopolitical factors adding to the uncertainty. However, spreads have since narrowed and are now close to year-to-date tights, with higher all-in yields continuing to attract selective yield buyers.
- Demand should improve further as volatility cools, supported by a still-healthy fundamental backdrop and disciplined balance sheets.
- With yield buyers active into higher rates, the key swing factor is volatility, with calmer rates providing additional support.

- With markets focused on inflation fallout from the oil shock, high yield should be approached in the near term with selectivity and an eye on volatility rather than broad beta.
- Risk pricing may shift if the conflict persists and markets start to reprice growth downside more aggressively, which would typically pressure lower-quality credit.
- Positioning should emphasize resilience to tighter financial conditions while watching the balance between inflation and growth narratives.

- Loan markets have steadied, with performance supported by strong CLO formation and generally constructive technicals.
- AI disruption remains a headline overhang, but impacts are increasingly issuer- and sector-specific, reinforcing a credit-selection market.
- Risks to watch include policy error, AI-related “price discovery” challenges, and geopolitical shocks that keep inflation and rate expectations volatile.
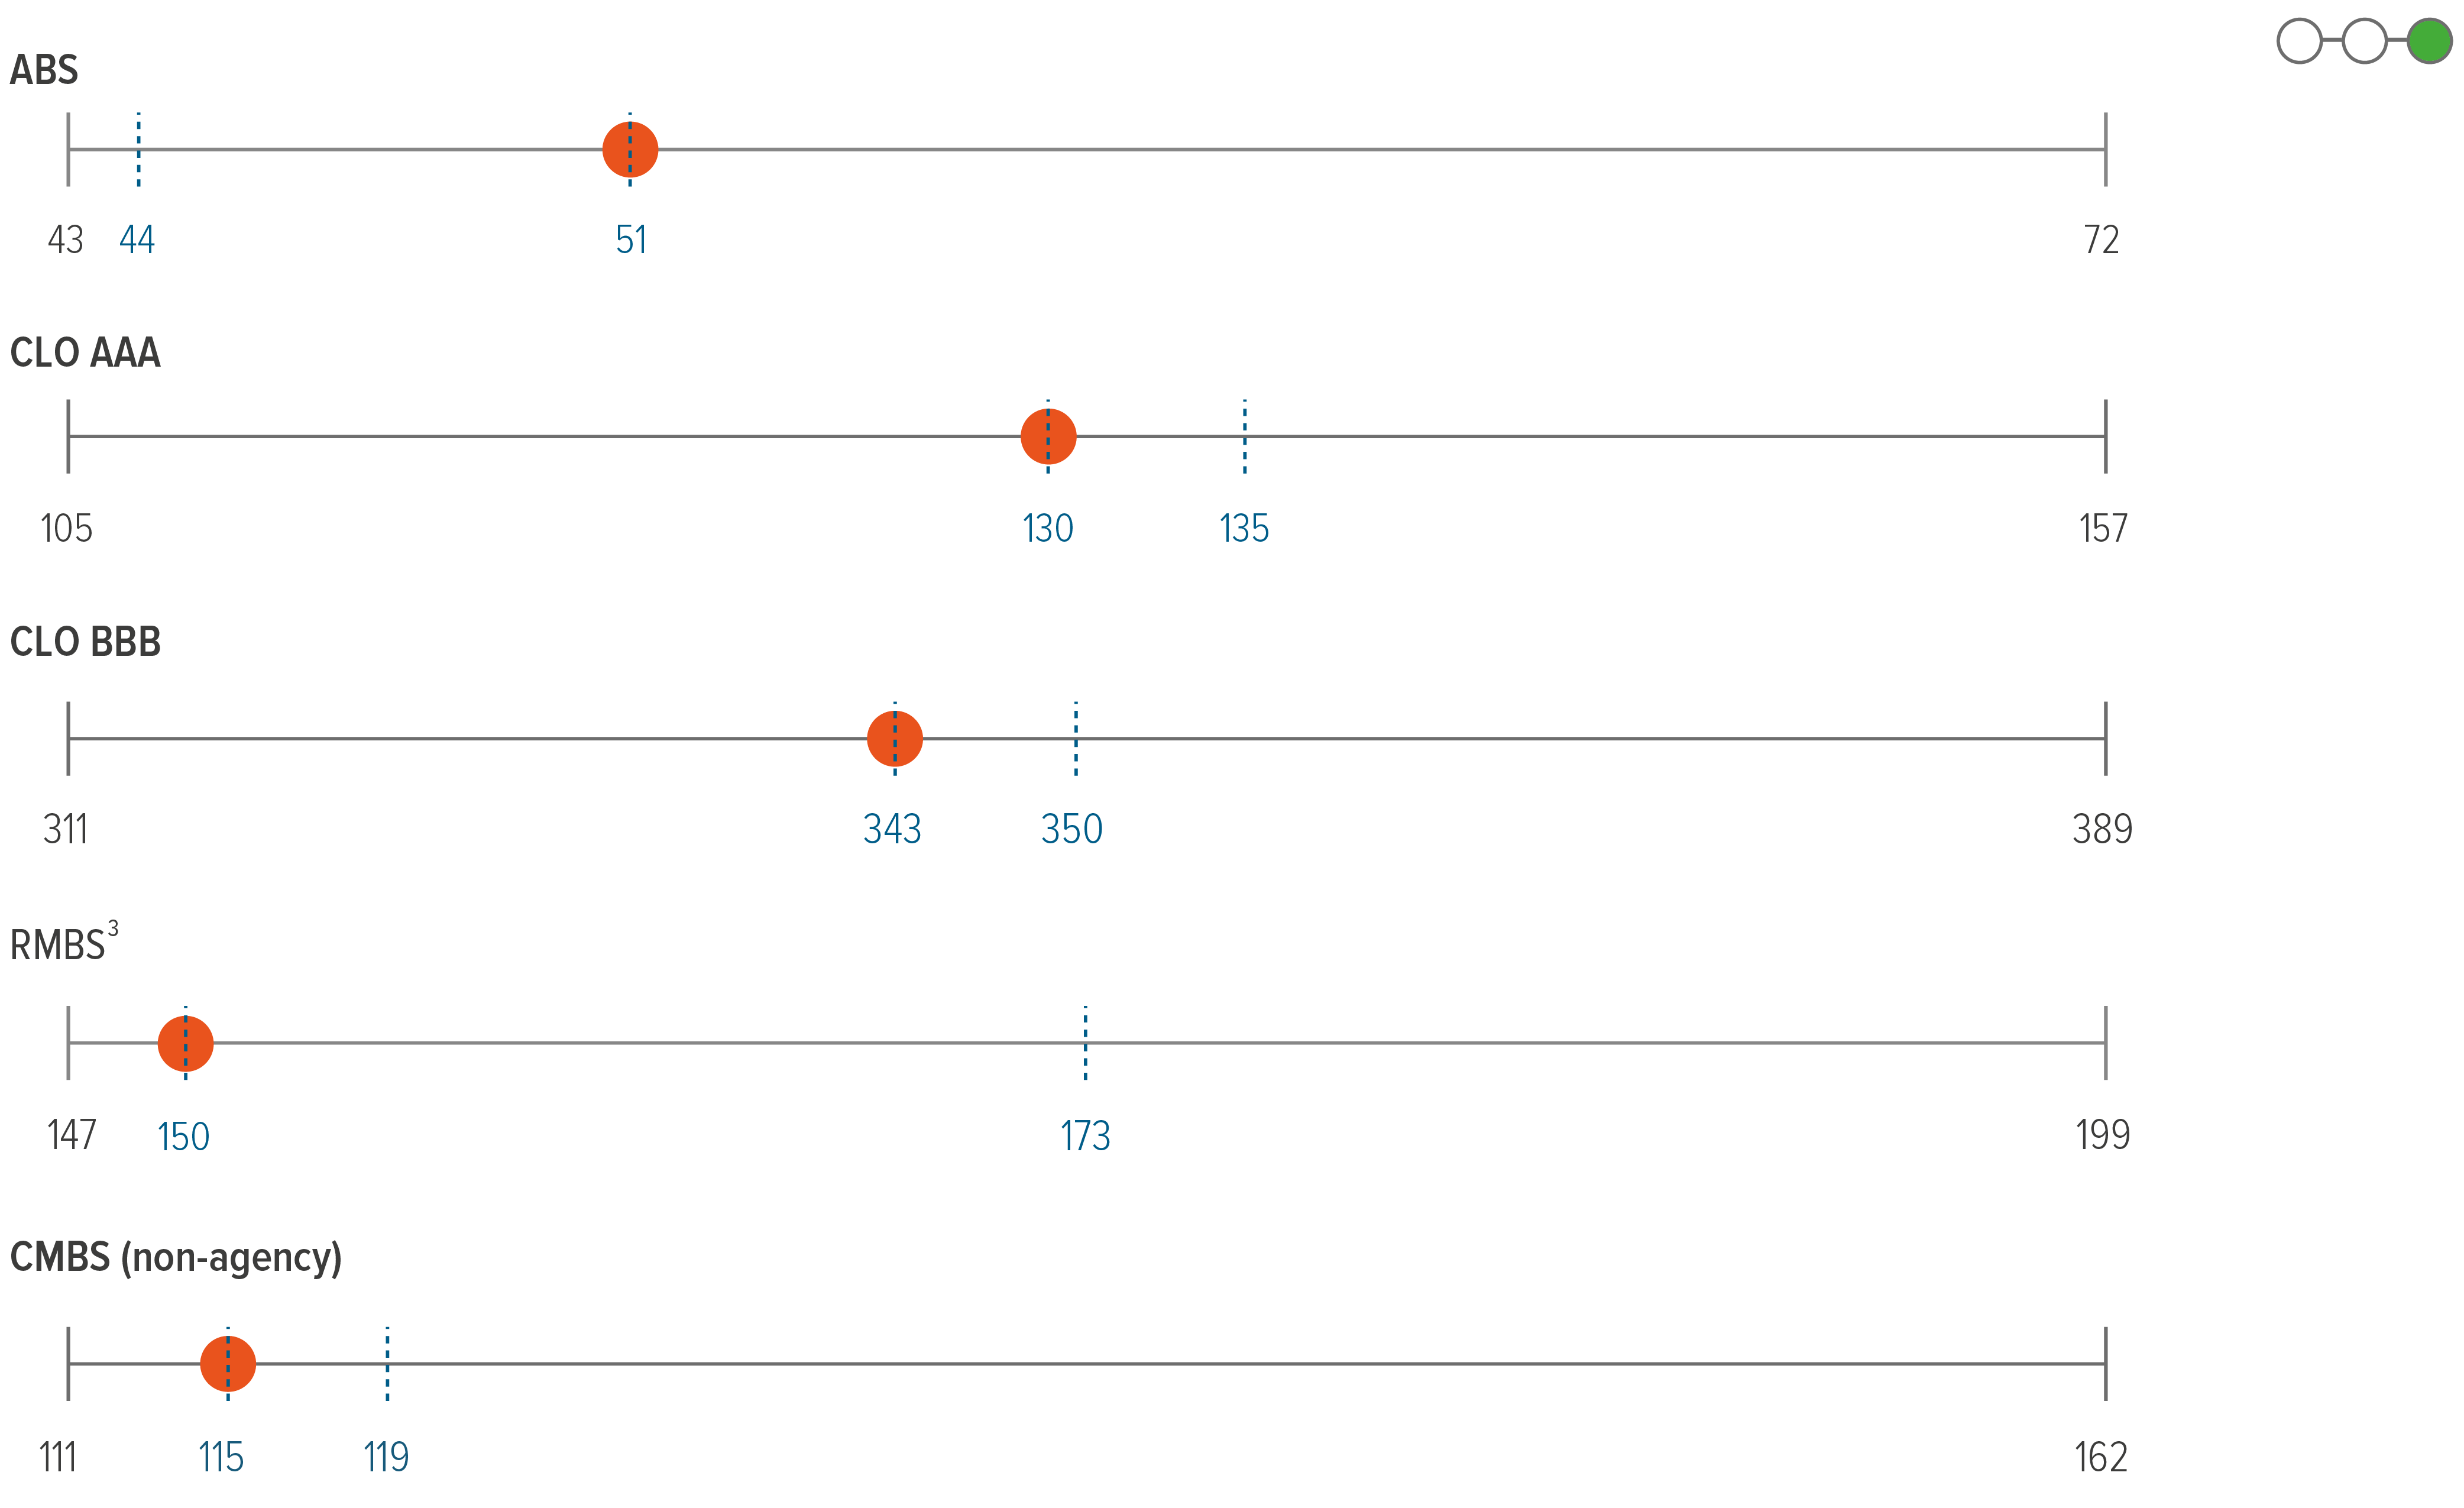
- Securitized markets show clear spread decompression and dispersion, but relative value has improved in select areas as supply/demand remains broadly manageable.
- High-quality CLOs benefited from floating-rate carry and firmer loan technicals, although below-IG rated tranches have sold off in response to the AI dynamic that has impacted loans.
- In CMBS, manageable supply and improving fundamentals support selective risk-taking, tempered by rate-vol sensitivity in lower-quality commercial real estate.

- Recent performance reflects rate volatility, technical flows, and policy headlines more than underlying fundamentals.
- Agency MBS can still play a stabilizing role, although near-term results may remain sensitive to rate volatility.
- Supply remains manageable and technicals could improve if demand broadens (e.g., regulatory clarity/ bank participation), even as policy risk stays in focus.

- The macro mix has turned less friendly as conflict-driven oil strength lifted the dollar and tightened financial conditions.
- Hard-currency spreads initially widened, but have since retraced near YTD tights, leaving relative value prospects unattractive.
- A key risk is that prolonged high energy prices raises stagflation pressure that could constrain EM central banks, keeping the setup relatively cautious.