Multi-Asset Perspectives: Markets Scramble Up a Wall of Worry

CIO, Multi-Asset Strategies and Solutions

An energy shock, sticky inflation, and fractured global policy have made the path forward less forgiving. With growth slowing but not breaking, we focus on quality, diversification, and disciplined positioning as the margin for error narrows.
Quick take
- Macro regime: An energy shock has disrupted an already-bumpy path to normal inflation, tightened financial conditions, and raised stagflation risk—pointing to a slower, more uncertain expansion rather than an outright recession. The impact is asymmetric; domestic energy production shields the U.S. more than most countries, although consumers are still feeling the squeeze. Asia bears the brunt.
- Policy outlook: The global policy backdrop has fractured. Central banks have shifted from coordinated easing to a cautious wait-and-see stance, with rates likely to stay higher for longer. Differing mandates are widening the gap. The European Central Bank’s singular focus on price stability leaves less room to look past inflation. The Federal Reserve’s dual mandate allows more flexibility.
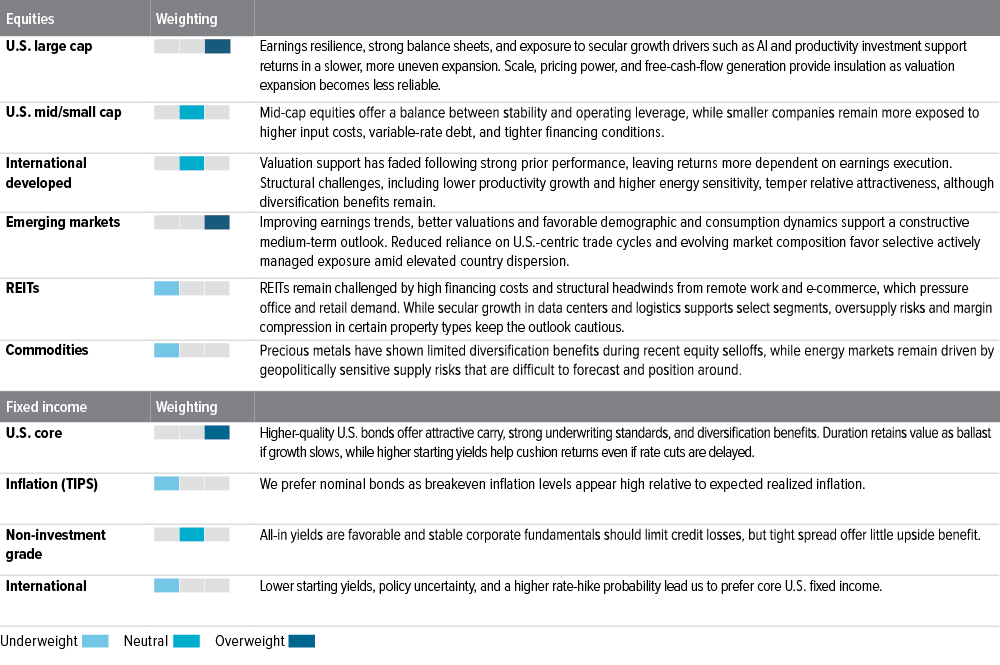
- Equities: Stocks remain our top choice for driving returns, but we’ve shifted our focus toward companies with strong earnings quality and solid balance sheets as valuation expansion becomes less reliable. The gap between winners and losers—across regions and market segments—is wide right now, and in this environment, positioning matters as much as the allocation itself.
- U.S. vs. international equities: We favor U.S. large- and mid-cap equities, which continue to benefit from strong earnings, pricing power, and ongoing investment in AI and productivity. International developed markets offer diversification value, but valuations are less attractive and returns depend more on companies delivering; here, we remain neutral. Emerging markets stand out for their long-term growth potential, improving fundamentals, and attractive relative valuations; we favor selective exposure in this area of the market.
- Fixed income: Bonds earn their place through income and stability, not capital appreciation. We favor higher-quality U.S. bonds and securitized credit and have nudged quality up a bit as the margin for error narrows. Non-U.S. fixed income is less attractive given lower yields, policy uncertainty, and sensitivity to U.S. dollar movements.
Market indicators
Economic growth (moderating)
U.S. real gross domestic product, a measure of economic output adjusted for inflation slowed to 2.0% during the fourth quarter of 2025 as the government shutdown weighed on the reading. A rebound is expected during the first quarter 2026 as policy stimulus begins to take effect, although uncertainty around the U.S.-Iran conflict and rising commodity prices will likely temper some of that recovery.
Fundamentals (positive)
S&P 500 earnings grew by more than 14% in the fourth quarter of 2025 compared with a year earlier—the fifth consecutive quarter of double-digit growth. Nine out of 11 sectors delivered positive earnings, with technology, industrials and materials leading the way. First quarter 2026 earnings are expected to grow at a similar pace, around 13%.
Valuations (stretched)
U.S. stocks are still expensive compared to their historical averages—especially large-cap companies—but strong earnings growth is helping bring those valuations back to more reasonable levels. Stocks in other countries are cheaper than U.S. stocks overall, but they’re not the bargain they used to be. Most of the gains in international markets over the last 15 months came from investors bidding up prices, not from companies actually growing their profits. The S&P 500 tells a different story; its gains were driven primarily by real earnings growth.
Sentiment (neutral)
Investors are increasingly chasing the market rally at all-time highs, evidenced by a rare rise in both stock prices and volatility costs as “FOMO” drives demand for upside protection. While popular trading baskets are becoming crowded, we haven’t reached peak euphoria yet, though the current environment suggests the near-term risk-reward balance is becoming more fragile.
Portfolio positioning
We are modestly tilted toward stocks over bonds, with a preference for U.S. large cap equities and highquality fixed income.
Macro backdrop: Uneven ground
The global economy was already losing momentum due to trade barriers, debt burdens and structural slowdowns in major economies before growth fell below its long-run trend.2 Then came the U.S.-Iran conflict and the energy shock it triggered: tighter financial conditions, a stalled disinflation process, and a growing risk of stagflation. How long the conflict lasts is an open question; how much it matters is not. Our base case is that some resolution will be reached before a global recession takes hold, but the expansion has less room for error than it did six months ago.
The shock isn’t hitting everyone the same way. The U.S. is better positioned than most energy-importing regions given larger domestic production, a more profitable corporate sector, and fiscal and private-capex support still cushioning activity. Asia is the most exposed region: roughly 89% of 2025 exports through the Strait of Hormuz were headed for Asian markets (Exhibit 1).3 That leaves much of Asia facing a tougher mix of weaker terms of trade, higher input costs, and more pressure on currencies and policy than the U.S.
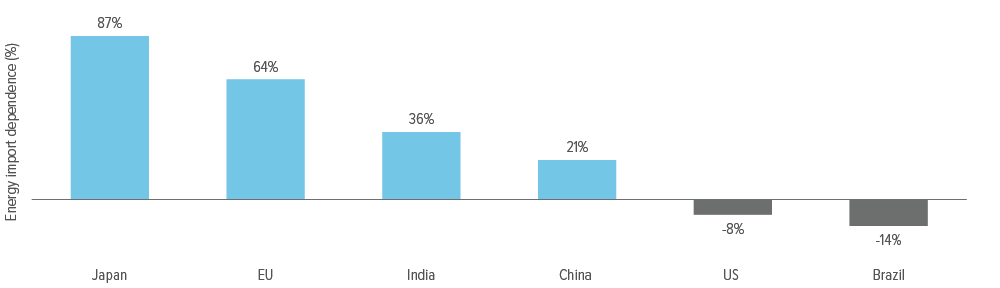
As of 03/31/26. Source: IEA and Goldman Sachs Asset Management.
This uneven impact has splintered the policy response. With G20 headline inflation projected at 4.0% in 2026,4 central banks that had been cutting rates are now pausing—and some are considering hikes (Exhibit 2).
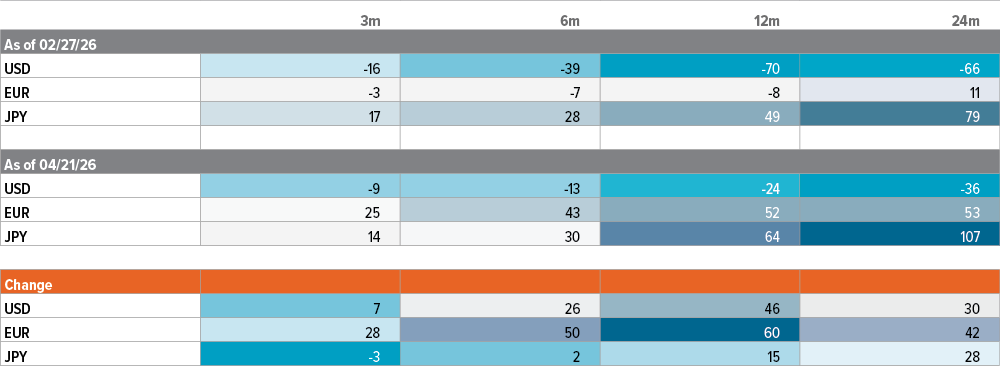
As of 04/21/26. Source: Bloomberg, Voya IM. An overnight index swap (OIS) curve is a market-derived representation of expected short-term interest rates over time, built from contracts where two parties exchange a fixed rate for a floating rate tied to an overnight lending benchmark. In the U.S., that’s typically the Secured Overnight Financing Rate (SOFR), which is the interest rate at which large financial institutions borrow cash overnight using U.S. Treasury securities as collateral. Each point on the curve reflects what the market collectively expects overnight rates to average over a given period.
U.S. equities: Where the footing is firmest
In a market where earnings dispersion is wide and growth is increasingly investment-driven, size and quality matter.
U.S. equities remain a core source of portfolio strength. Earnings have held up better than sentiment—profit growth is intact, balance sheets are solid, and capital investment tied to AI infrastructure and data centers hasn’t slowed. Recent market pressure has come from multiple compression, not earnings downgrades; this reflects a repricing of risk, not a fracture in fundamentals (Exhibit 3). Scale, pricing power, and strong free cash flow keep U.S. large-cap stocks our preferred allocation as global growth stays uneven.
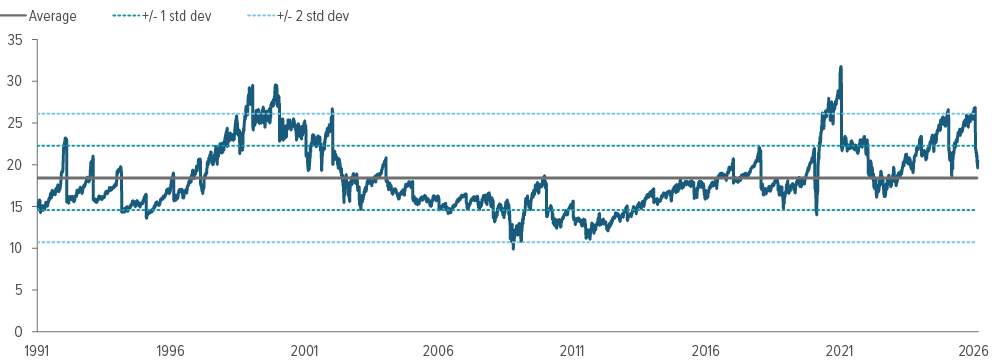
As of 04/06/26. Source: Bloomberg, Voya IM. Standard deviation measures how much a set of returns tends to deviate from their average over time. It serves as the primary measure of total risk. It captures both systematic risk (the portion tied to broad market movements) and idiosyncratic risk specific to a given security or portfolio. A higher standard deviation indicates a wider distribution of potential outcomes; a lower one suggests returns cluster more tightly around the expected value.
Recent volatility also created a tactical opening in large-cap growth. Stocks that sold off despite solid fundamentals now offer better entry points without any deterioration in the underlying case.
Midcaps offer a different kind of resilience. Compared with smaller companies, they tend to carry longer-term debt and more stable profit margins, which reduces their exposure to the financing pressure that has squeezed the lower end of the market. Smaller companies face a more challenging environment: higher variable-rate debt, shorter maturities, and less room to absorb rising cost. In a higher-for-longer rate environment, these differences add up.
International equities: Proceed with care
The case for increasing international exposure has weakened. After 15 months of strong performance, a large portion of returns across developed international markets came from investors simply paying more for stocks than from earnings growth, leaving prices closer to fair value with less of a cushion. In Europe, for example, markets rallied into early 2026 on improving sentiment, then pulled back as geopolitical risks mounted and 2025 earnings expectations were revised lower following weaker-than-anticipated results (Exhibit 4). Future returns appear more dependent on companies actually delivering earnings growth than on valuations expanding further. Relative to U.S. equities, we have less confidence that international developed markets will clear that bar.
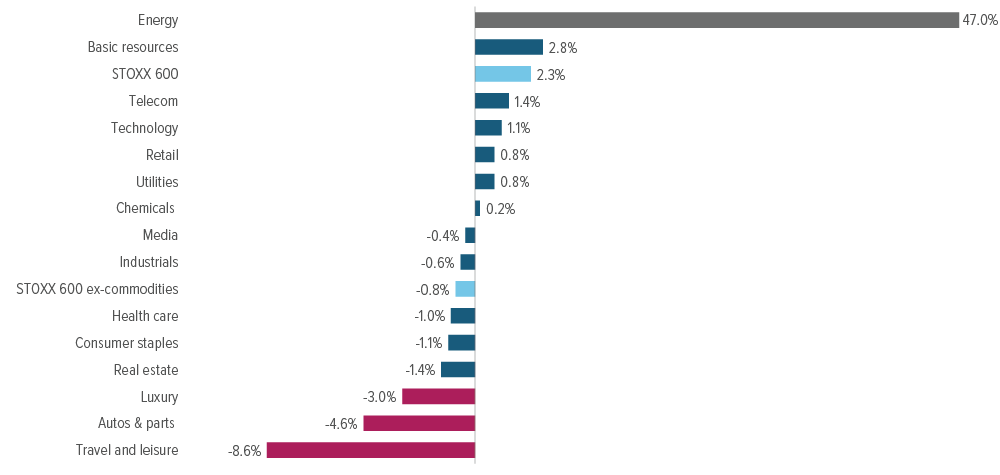
As of 04/17/26. Source: Goldman Sachs Global Investment Research. The STOXX 600 Index tracks the performance of the 600 largest public companies across 17 European countries, spanning large, mid, and small cap stocks. The STOXX 600 ex-Commodities Index measures the performance of the same companies, excluding energy and basic materials companies. Stripping out commodities isolates how the rest of the European market is performing independent of oil, gas, and mining stocks, which tend to move on supply and geopolitical factors rather than broader economic conditions. It’s useful for understanding whether European corporate earnings trends are broad-based or concentrated in commodity-driven sectors.
That said, international fundamentals aren’t uniformly weak. Fiscal policy remains supportive in both Europe and Japan; the latter stands out due to its corporate governance reforms, shareholder return programs, and policy backing, all of which offer a reasonable foundation for medium-term returns. These are specific, targeted reasons to maintain exposure, not a broad case for adding it.
The structural picture adds further reason for caution. Many international developed markets carry less direct technology exposure and greater dependence on energy imports, leaving parts of Europe and Asia more vulnerable to commodity-driven inflation. The U.K. compounds this; a defensively oriented market structure and fiscal constraints limit its relative growth potential, even if they offer modest downside risk mitigation.
International equities still offer diversification value, but the easy gains are behind them. The remaining upside depends on earnings delivery, and that’s a less certain bet than it was 15 months ago. Our neutral allocation reflects that reality.
Emerging market equities: A different route up
Emerging market equities offer an attractive medium term opportunity as structural advantages combine with a more supportive macro and policy environment. EM economies now account for roughly 40% of global personal consumption5 and growth is increasingly driven by local demand rather than exports to the U.S. or Europe. That reduces their sensitivity to U.S. trade cycles— a vulnerability that defined prior EM downturns. Debt burdens are lower than in most developed markets, demographics are more favorable, and both of these factors give EM central banks more room to maneuver than their developed-market peers, supporting above average growth potential over the next several years.
The composition of emerging equity markets has also shifted. Technology is now the largest sector in the MSCI Emerging Markets Index, displacing the commodity and energy exposure that once made EM a purely cyclical bet. Regional supply chains are deepening, trade relationships are diversifying, and the earnings base is moving up the value chain—from raw materials toward hardware, digital services, and innovation. Country-level dispersion within EM remains wide, which makes a case for active management over broad index exposure.
The fundamental picture supports this case. Earnings growth expectations for the MSCI Emerging Market Index sit above 30% for 2026,6 and analysts have been raising their estimates, not cutting them. The gains EM equities have posted are driven by genuine earnings growth; companies are delivering, not just getting more expensive. That said, countries are moving in very different directions—on policy, growth, and trade relationships. That creates wide variation in outcomes across EM markets. Some will outperform; many won’t. Valuations are cheaper than in developed markets, but selecting the right exposure matters more than owning the index.
Fixed income: The rope, not the route
Fixed income earns its place through income and stability, not return maximization. The current environment—geopolitical pressure, energy risk, and mixed macroeconomic signals—leaves little room for error, which means discipline matters more than chasing yield.
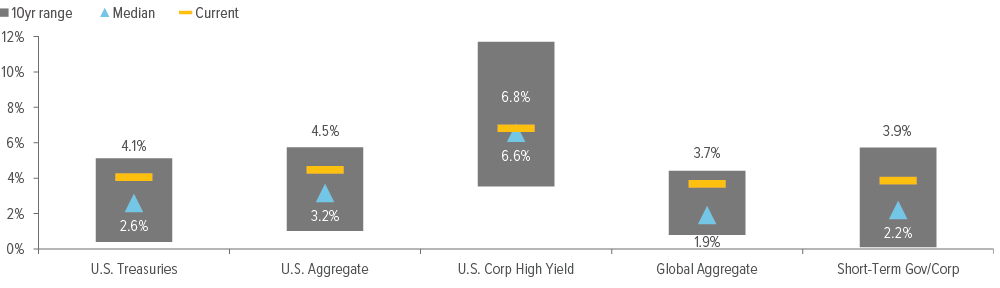
As of 04/06/26. Source: Bloomberg, Voya IM. U.S. Treasuries are represented by the Bloomberg U.S. Treasury Index. U.S. bonds are represented by the Bloomberg Aggregate U.S. Bond Index. U.S. corporate high-yield bonds are represented by the Bloomberg U.S. Corporate High Yield Bond Index. Global bonds are represented by the Bloomberg Global Aggregate Bond Index. Short-term government and corporate bonds are represented by the Bloomberg Short-Term Government/Corporate Total Return Index (Unhedged). See index definitions on the last pages.
Against that backdrop, we’ve shifted toward higher-quality holdings—areas where income doesn’t depend on credit spreads staying tight. We favor securitized credit over corporate bonds. It offers better compensation for cyclical risk, and its underlying structure is less exposed to the economic cycle. Lower-quality corporate bonds don’t have that cushion; if rates stay high, refinancing becomes a real problem with limited room to absorb it.
Our quality bias extends beyond sector to geography. The U.S. dollar continues to shape global fixed income markets. In the near term, its safe haven role should keep it strong, tightening conditions outside the U.S. and adding pressure on more externally dependent economies (Exhibit 6). A falling rate path may eventually weigh on the dollar, but that’s not a concern right now.
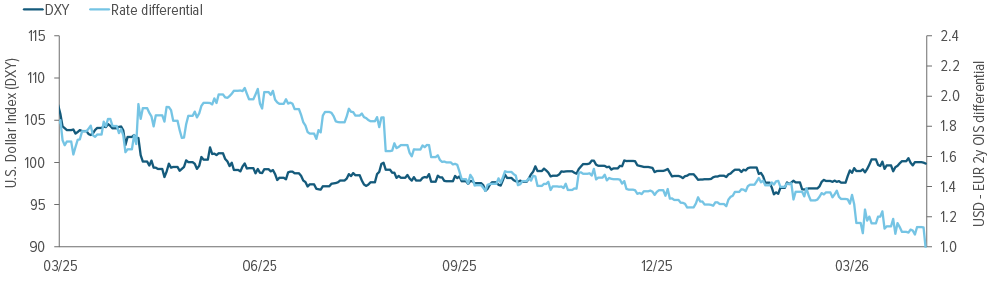
As of 04/06/26. Source: Bloomberg, Voya IM. The DXY is the U.S. Dollar Index, a measure of the dollar’s value relative to a basket of six major currencies (euro, yen, British pound, Canadian dollar, Swedish krona, Swiss franc). A reading of 100 is roughly the historical baseline; above 100 means the dollar is stronger than average relative to that basket and below 100 means it’s weaker. The USD-EUR 2y OIS differential measures the gap between U.S. and European two-year overnight index swap (OIS) rates. When the gap is wide, U.S. short-term rates are significantly higher than European ones, which historically pulls capital toward the dollar and strengthens it. When the gap narrows, that interest rate advantage shrinks; the dollar typically weakens in response.
Outside the U.S., opportunities are more limited. Developed market yields are too low to compensate for the policy uncertainty that accompanies them. EM debt carries its own risks; dollar strength and energy prices can move it quickly and not in investors’ favor. Quality and income keep us anchored to U.S. markets.
Commodities: The hazard on the route
The Middle East shock hits hardest in energy markets, where supply disruptions translate quickly into higher costs across the broader economy. Interrupted oil and gas flows have pushed up risk premiums and underscored just how much the global economy still depends on reliable energy, especially as power demand keeps climbing. Even without a prolonged outage, precautionary buying and security concerns could keep prices above what supply and demand alone would justify.
The energy shock contributed to broader market stress, and that pressure showed up in unexpected places. Gold, typically a safe haven, behaved more like a liquidity source during the March drawdown— sold to cover margin calls as conditions deteriorated, then rebounded alongside stocks as they recovered in April. Its correlation with equities turned sharply positive, which is precisely the opposite of what investors rely on gold for.
Agriculture felt the energy disruption differently—not just through fuel costs alone, but through hydrocarbon-linked inputs like nitrogen-based fertilizers that have been squeezing farm margins. Higher food prices are likely to follow, just with a delay.
Conclusion: Keep climbing
Macroeconomic conditions are shifting, but our investment conviction holds steady. Growth is slowing, not breaking. The U.S. is weathering this better than most, and market leadership is moving away from rising valuations toward actual earnings delivery—a transition that favors quality. That keeps us overweight stocks, with a preference for U.S. large caps, selective exposure in international developed markets, and emerging markets where valuations and structural tailwinds are strongest. Within fixed income, quality matters more than yield.
The main risk is a longer disruption than markets are pricing in. Right now, investors are betting on a resolution and the return of normal oil flows sooner rather than later. If that timeline slips, the consequences could compound quickly; weaker demand would push back rate cuts, and markets that have priced in a smooth resolution would face a forced and rapid adjustment.
Index and market term definitions
The S&P 500® Index tracks the performance of approximately 500 of the largest publicly traded U.S. companies’ stocks. It is widely used as a benchmark for the overall U.S. stock market.
The MSCI Emerging Markets Index measures stock market performance across emerging market countries, including regions such as Asia, Latin America, Eastern Europe, the Middle East, and Africa.
The Bloomberg U.S. Treasury Index tracks the performance of U.S. government bonds—debt issued and backed by the federal government across a range of maturities. It’s widely used as a benchmark for the safest segment of the fixed income market.
The Bloomberg U.S. Aggregate Bond Index is a broad measure of the U.S. investment-grade bond market, covering government bonds, corporate bonds, and mortgage-backed securities. It’s the most commonly referenced benchmark for the overall U.S. bond market.
The Bloomberg U.S. Corporate High Yield Bond Index tracks bonds issued by U.S. companies that carry below investment-grade credit ratings. These bonds offer higher yields to compensate investors for the greater risk that the issuer may not be able to repay its debt.
The Bloomberg Global Aggregate Bond Index measures the performance of investment-grade bonds issued across global markets, including government, corporate, and securitized debt from both developed and emerging economies. It serves as the primary benchmark for the broad global bond market.
The Bloomberg Short-Term Government/Corporate Total Return Index (Unhedged) tracks investment-grade government and corporate bonds with shorter maturities, typically one to three years. Shorter maturities are less sensitive to interest rate changes, making this segment of the market generally less volatile than longer-duration bond indexes.
Breakeven inflation is the difference between yields on nominal Treasury bonds and inflation-protected bonds, reflecting the market’s expectation for future inflation.
Core PCE (Personal Consumption Expenditures) inflation is a measure of inflation that tracks changes in prices consumers pay for goods and services, excluding food and energy, which tend to be more volatile. It is the Federal Reserve’s preferred inflation gauge.
Credit spreads refer to the difference in yield between bonds of different credit quality, often used to assess perceived credit risk in the market.
Duration is a measure of a bond’s sensitivity to changes in interest rates. Longer-duration bonds typically experience larger price fluctuations when rates change.
Earnings growth refers to the change in total profits reported by companies within a market index over a specified period, typically compared year over year.
Earnings estimates are forward-looking projections made by analysts regarding future earnings of companies.
Free cash flow refers to the money a company has left over after paying for everything it needs to keep the business running and growing.
Gross domestic product (GDP) is a measure of the total value of goods and services produced within a country over a specific period. When adjusted for inflation, it reflects “real” economic growth.
Headline inflation is a broad measure of inflation that includes all categories of consumer spending, including food and energy.
Nominal bonds are fixed-income securities that pay a predetermined interest rate—called the coupon—on a set face value, with the principal returned in full at maturity.
Price-to-earnings (P/E) ratio measures how much investors are willing to pay for a dollar of a company’s profits. For example, if a company earns $5 per share and the stock trades at $100, the P/E ratio is 20. That means the market is paying $20 for every $1 the company earns. High P/E stocks tend to be ones where investors are betting on future growth; they’re paying a premium today for earnings they expect tomorrow. Low P/E stocks can signal a bargain, but they can also signal that investors don’t see much growth ahead.
Secular growth refers to a long-term, sustained increase in a company, industry, or sector that’s driven by structural changes rather than short-term economic cycles.
Standard deviation measures how much a set of returns tends to deviate from their average over time. For example, a fund that returns 8% on average but swings between -10% and +26% in any given year has a high standard deviation. A fund with the same 8% average return that rarely strays more than a point or two in either direction has a low standard deviation. In finance, standard deviation is the most widely used measure of volatility and serves as a primary proxy for total risk. It treats upside and downside deviations equally—a large gain registers the same as a large loss—which means it captures the full range of uncertainty around an expected return rather than isolating the unfavorable outcomes alone.
Treasury Inflation-Protected Securities (TIPS) are U.S. government bonds designed to help protect investors from inflation. The principal value adjusts with changes in inflation as measured by the Consumer Price Index.
The U.S. dollar (USD) is the official currency of the United States. Its strength or weakness influences global trade, commodity prices, and returns on international investments.
Valuation multiples include metrics that compare a company’s stock price to measures of its financial performance. Investors use them to assess whether stocks appear relatively expensive or inexpensive.
Variable-rate debt is a loan or a bond whose interest rate isn’t fixed, but adjusts periodically based on a benchmark rate, such as the federal funds rate.
Yield-to-worst is the lowest return an investor could earn on a bond without the issuer actually defaulting.