Bank building

Weekly Notables

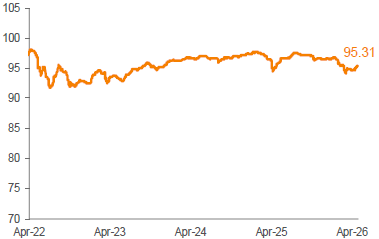
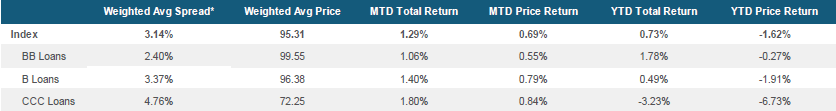
Risk assets maintained their recent momentum, with equities delivering another week of strong gains and credit spreads tightening further. Although oil prices and Treasury yields both edged higher amid continued uncertainty surrounding the Iran conflict, these concerns were offset by strong corporate earnings and stable economic data prints. As expected, the Fed left interest rates unchanged at this week’s FOMC meeting, but there was more dissent than usual among members, with the committee moving from an easing bias to a more neutral stance. Fed funds futures continue to price in zero rate cuts in 2026, which is supportive of a strong carry environment in loans. The Morningstar LSTA U.S. Leveraged Loan Index (Index) returned 0.13% for the seven-day period ending April 30. Coupon income drove performance this week, as the weighted average Index bid price moved just one basis point higher, to 95.31. 

The primary market experienced an uptick in activity this week, although much of the increase was attributable to repricings and amend-to-extend transactions. Away from these deals, new-issue supply remained subdued at just $5.4 billion. April’s issuance volume totaled $14.8 billion, the lowest monthly figure since last April at the height of the tariff-related volatility. In the forward calendar, repayments now outstrip supply by $11.6 billion, compared to net repayments of $4.7 billion last week. 

Secondary trading levels were stable this week. Positive earnings and strong demand from ramping CLOs are providing strong bid support, with stable and higher-quality credits remaining in high demand in the absence of a deep new issue pipeline. The percentage of loans trading above par continues to increase and is now tracking 38.9% compared to the lows of 9.3% seen in March before the loan market resumed this latest ongoing rally. There’s increased market chatter whether the continued rally in loan prices ushers in a new repricing wave given the strong technicals. Earnings news were front and center, as a handful of issuers reported quarterly results with generally positive trends providing continued tailwinds. Performance across ratings reflected an up-in-quality bias among investors, with CCCs trailing higher-rated credits after a few weeks of outperformance. 

CLO managers priced four new deals this week, bringing YTD issuance to $54.6 billion. The recent tightening in the liability stack and the decline in the overall cost of capital have resulted in a resurgence in CLO issuance volume. It’s likely that this momentum will continue into the coming weeks based on the volume of deals that have been announced and are currently being marketed. US retail loan funds experienced a modest net inflow of $14 million for the week ending April 29, according to Lipper. 

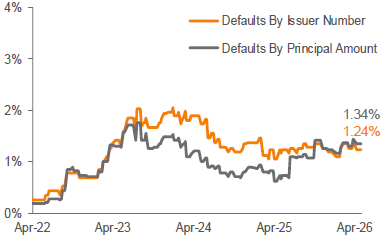
There were no payment defaults in the Index this week.

Average Bid
April 1, 2022 – April 30, 2026
Average Bid
Average 3-YR Call Secondary Spreads 1,2
April 1, 2022 – April 24, 2026
Average 3-YR Call Secondary Spreads 1,2
Lagging 12-Month Payment Default Rate 3
April 1, 2022 – April 30, 2026
Lagging 12-Month Payment Default Rate 3
Morningstar LSTA US Leveraged Loan Index Stats

Source: Pitchbook Data, Inc./LCD, Morningstar LSTA US Leveraged Loan Index. Additional footnotes and disclosures on back page. Past performance is no guarantee of future results. Investors cannot invest directly in the Index. *The Index’s average nominal spread calculation includes the benefit of base rate floors (where applicable).

5452243

Unless otherwise noted, the source for all data in this report is Pitchbook Data, Inc/LCD. Pitchbook Data/LCD does not make any representations or warranties as to the completeness, accuracy or sufficiency of the data in this report. 

1. Assumes 3 Year Maturity. Three-year maturity assumption: (i) all loans pay off at par in 3 years, (ii) discount from par is amortized evenly over the 3 years as additional spread, and (iii) no other principal payments during the 3 years. Discounted spread is calculated based upon the current bid price, not on par. Please note that Index yield data is only available on a lagging basis, thus the data demonstrated is as of April 24, 2026. 

2. Excludes facilities that are currently in default. 

3. Issuer default rate is calculated as the number of defaults over the last twelve months divided by the number of issuers in the Index at the beginning of the twelve-month period. Principal default rate is calculated as the amount defaulted over the last twelve months divided by the amount outstanding at the beginning of the twelve-month period.

General Risks for Floating Rate Senior Loans: Floating rate senior loans involve certain risks. Below investment grade assets carry a higher than normal risk that borrowers may default in the timely payment of principal and interest on their loans, which would likely cause the value of the investment to decrease. Changes in short-term market interest rates will directly affect the yield on investments in floating rate senior loans. If such rates fall, the investment’s yield will also fall. If interest rate spreads on loans decline in general, the yield on such loans will fall and the value of such loans may decrease. When short-term market interest rates rise, because of the lag between changes in such short-term rates and the resetting of the floating rates on senior loans, the impact of rising rates will be delayed to the extent of such lag. Because of the limited secondary market for floating rate senior loans, the ability to sell these loans in a timely fashion and/or at a favorable price may be limited. An increase or decrease in the demand for loans may adversely affect the loans.

This commentary has been prepared by Voya Investment Management for informational purposes. Nothing contained herein should be construed as (i) an offer to sell or solicitation of an offer to buy any security or (ii) a recommendation as to the advisability of investing in, purchasing or selling any security. Any opinions expressed herein reflect our judgment and are subject to change. Certain of the statements contained herein are statements of future expectations and other forward-looking statements that are based on management’s current views and assumptions and involve known and unknown risks and uncertainties that could cause actual results, performance or events to differ materially from those expressed or implied in such statements. Actual results, performance or events may differ materially from those in such statements due to, without limitation, (1) general economic conditions, (2) performance of financial markets, (3) changes in laws and regulations and (4) changes in the policies of governments and/or regulatory authorities. The opinions, views and information expressed in this commentary regarding holdings are subject to change without notice. The information provided regarding holdings is not a recommendation to buy or sell any security. Fund holdings are fluid and are subject to daily change based on market conditions and other factors. 

The information contained in this document has been prepared solely for informational purposes and is not an offer or invitation to buy or sell any security or to participate in any trading activity. This document is intended only for professional investors and describes a strategy only. Any products or securities that are mentioned in this document have their own particular terms and conditions, which should be consulted before entering into any transaction. 

In relation to all the investment funds mentioned in this document, a Financial Instruction Leaflet or simplified prospectus has been published containing all necessary information about the product, the costs and the risks involved. Do not take unnecessary risk. Read the Financial Instruction Leaflet or prospectus. Investment funds do not offer guaranteed returns and any past returns are not indicative of, nor do they secure, future returns. 

The material presented is compiled from sources thought to be reliable, but accuracy and completeness cannot be guaranteed. Any opinions expressed herein reflect our judgment at this date and are subject to change without notice. Neither Voya Investment Management nor any other company or unit belonging to Voya Financial, nor any of its officers, directors, or employees accept any liability or responsibility in respect to the information or any recommendations expressed herein. No liability is accepted for any losses sustained by readers as a result of using this publication or basing decisions on it. The value of your investments may rise or fall. Past performance is not indicative of future results. Investments involve risk. The primary risks of investing in senior bank loans include, but are not limited to, credit risk (the risk that a borrower may default in the payment of interest and/or principal on its loans), interest rate risk (the risk that the yield on an investment will rise and fall in response to changes in market rates of interest), and market risk (the risk that the value of a loan will rise or fall in response to general economic conditions and events). Senior bank loans are typically below investment grade in quality and therefore present a greater than normal risk of default. 

This document and the information contained herein is confidential and must not be copied, reproduced, distributed, or passed to any person at any time without the prior written consent of Voya Investment Management. Dutch laws apply to this disclaimer.

Top